FIGURE SUMMARY
Title

Essential role of prostaglandin E2 and the EP3 receptor in lymphatic vessel development during zebrafish embryogenesis

Authors
Iwasaki, R., Tsuge, K., Kishimoto, K., Hayashi, Y., Iwaana, T., Hohjoh, H., Inazumi, T., Kawahara, A., Tsuchiya, S., Sugimoto, Y.
Source
Full text @ Sci. Rep.

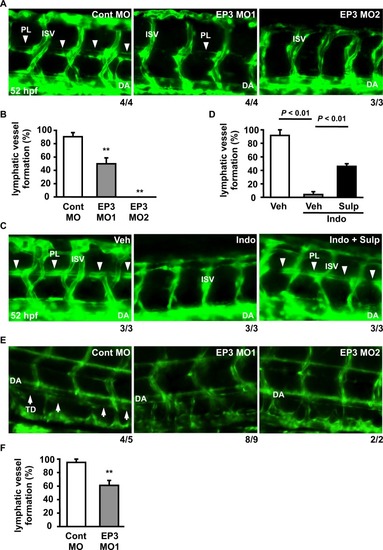
Role of the PGE2-EP3 pathway in lymphatic vessel formation. (A) Tg(fli1a:egfp) embryos were injected with Cont MO, EP3 MO1, or MO2. Images of the trunks were taken at 52 hpf. (B) The ratio of PL-positive segments in nine consecutive segments of (A) was quantitated. Each value represents the mean ± SEM (N = 3–4). (C) Tg(fli1a:egfp) embryos were treated with vehicle (Veh) or indomethacin (Indo; 100 μM) in the absence or presence of sulprostone (Sulp; 1 μM) from 0 to 52 hpf. Images were taken at 52 hpf. (D) The ratio of PL-positive segments in nine consecutive segments of (C) was quantitated. Each value represents the mean ± SEM (N = 3). (E) Tg(fli1a:egfp) embryos were injected with Cont MO, EP3 MO1, or EP3 MO2. Images of the trunks were taken at 5 dpf. (F) The ratio of TD-positive segments in eight consecutive segments of Cont MO- or EP3 MO1-injected morphants was quantitated. Each value represents the mean ± SEM (N = 5–9). **P < 0.01 vs Cont MO. DA: dorsal aorta; ISV: intersomitic vessel; PL: parachordal lymphangioblast; TD: thoracic duct. The PL is indicated by arrowheads, and the TD is indicated by arrows. The number at the bottom right of each panel indicates the number of embryos demonstrating the phenotype shown in the panel over the total number of embryos analyzed in a representative experiment.

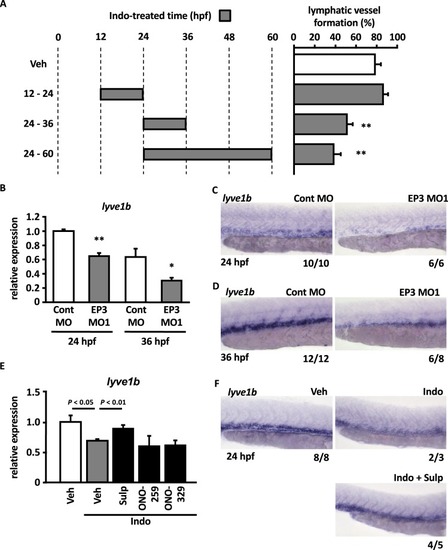
Role of the PGE2-EP3 pathway in the lymphatic specification from venous to lymphatic endothelial cells. (A) Tg(fli1a:egfp) embryos were treated with Veh or Indo (100 μM) for the indicated times. The ratio of PL-positive segments at 60 hpf was quantified. Each value represents the mean ± SEM (N = 5). **P < 0.01 vs Veh. (B) Relative expression levels of lyve1b were quantified by RT-qPCR in morphants at 24 and 36 hpf. Values are shown relative to the value obtained with Cont MO at 24 hpf. Each value represents the mean ± SEM (N = 3–4) *P < 0.05, **P < 0.01 vs Cont MO at each corresponding time. (C,D) Expression of lyve1b was analyzed by WISH in morphants at 24 hpf (C) and 36 hpf (D). (E,F) Zebrafish embryos were treated with Veh or Indo (100 μM) in the absence or presence of EP agonists (10 μM) from 0 to 24 hpf. The expression level of lyve1b was quantified by RT-qPCR (E). The values are shown relative to the value obtained with Veh. Each value represents the mean ± SEM (N = 3–4). Expression of lyve1b was analyzed by WISH at 24 hpf (F). The number at the bottom right of each panel indicates the number of embryos demonstrating the phenotype shown in the panel over the total number of embryos analyzed in a representative experiment.

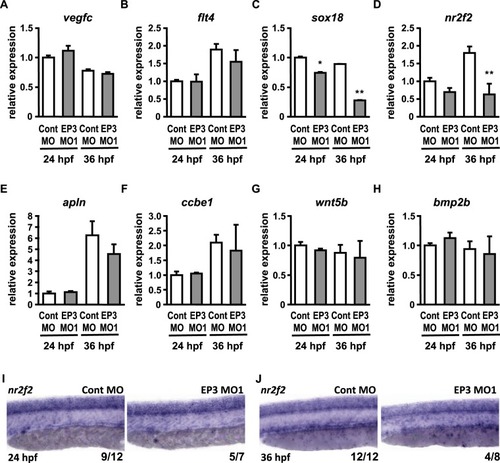
Expression of genes involved in lymphatic specification. (AH) Relative expression levels (at 24 and 36 hpf) of genes involved in lymphatic specification were quantified by RT-qPCR in morphants injected with Cont MO or EP3 MO1. Values are shown relative to the value obtained with Cont MO at 24 hpf. Each value represents the mean ± SEM (N = 3). *P < 0.05, **P < 0.01 vs Cont MO at each corresponding time. (I,J) Expression of nr2f2 was analyzed by WISH in morphants at 24 and 36 hpf. The number at the bottom right of each panel indicates the number of embryos demonstrating the phenotype shown in the panel over the total number of embryos analyzed in a representative experiment.

EXPRESSION / LABELING:
Genes:
Fish:
Knockdown Reagent:
Anatomical Terms:
Stage Range: Prim-5 to Prim-25
PHENOTYPE:
Fish:
Knockdown Reagent:
Observed In:
Stage Range: Prim-5 to Prim-25

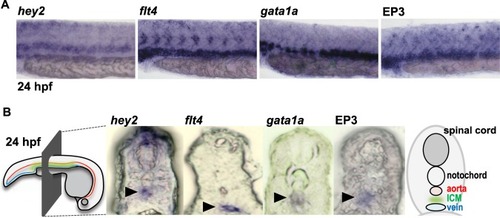
EP3 receptor mRNA is expressed in the posterior cardinal vein and the neighboring ICM. (A,B) Regions of expression of marker genes and the EP3 receptor were analyzed by WISH at 24 hpf (A) and subsequently by microscopic examination of their cross-sections (B). Arrowheads indicate the regions where the signals derived from each gene were observed.

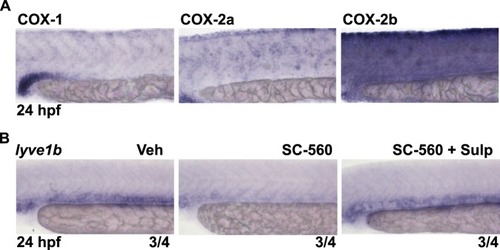
COX1-derived PGE2 is involved in the lymphatic specification. (A) Expression of COX1, COX2a, and COX2b was analyzed by WISH at 24 hpf. (B) Zebrafish embryos were treated with Veh or SC-560 (25 μM) in the absence or presence of Sulp (10 μM) from 0 to 24 hpf, and the expression of lyve1b was analyzed by WISH at 24 hpf. The number at the bottom right of each panel indicates the number of embryos demonstrating the phenotype shown in the panel over the total number of embryos analyzed in a representative experiment.

EXPRESSION / LABELING:
Genes:
Fish:
Conditions:
Anatomical Terms:
Stage: Prim-5
PHENOTYPE:
Fish:
Condition:
Observed In:
Stage: Prim-5

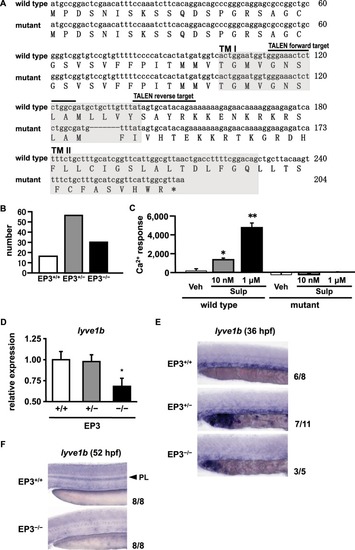
Effect of EP3 receptor deficiency on lymphatic specification and development. (A) Sequence alignment of the wild-type and mutant EP3 receptor. The seven base-pair deletion in mutant EP3 receptor is indicated by a dotted line. Transmembrane (TM) regions of the wild-type EP3 receptor are indicated by gray boxes. (B) Number of live births of EP3+/+, EP3+/−, and EP3−/− zebrafish. (C) HeLa cells were transfected with an expression vector encoding either the wild-type or mutant EP3 receptor. After 24 h, cells were incubated with loading buffer for 1 h and then treated with Veh or Sulp. Induced intracellular Ca2+ mobilization was evaluated by AUC analysis. *P < 0.05, **P < 0.01 vs Veh. Each value represents the mean ± SEM (N = 3). (D) Relative expression levels of lyve1b were quantified by RT-qPCR in EP3+/+, EP3+/−, and EP3−/− zebrafishs at 24 hpf. Values are shown relative to the value obtained with EP3+/+. Each value represents the mean ± SEM (N = 8–12) *P < 0.05 vs EP3+/+. (E) Expression of lyve1b was analyzed by WISH in EP3+/+, EP3+/−, and EP3−/− zebrafish at 36 hpf. (F) Expression of lyve1b was analyzed by WISH in EP3+/+ and EP3−/− zebrafish at 52 hpf. The PL is indicated by an arrowhead. The number at the bottom right of each panel indicates the number of embryos demonstrating the phenotype shown in the panel over the total number of embryos analyzed in a representative experiment.

EXPRESSION / LABELING:
Gene:
Fish:
Anatomical Terms:
Stage Range: Prim-5 to Long-pec
PHENOTYPE:
Fish:
Observed In:
Stage Range: Prim-5 to Long-pec
Acknowledgments
This image is the copyrighted work of the attributed author or publisher, and ZFIN has permission only to display this image to its users. Additional permissions should be obtained from the applicable author or publisher of the image. Full text @ Sci. Rep.