
Figure 2
- ID
- ZDB-IMAGE-190723-299
- Genes
- Publication
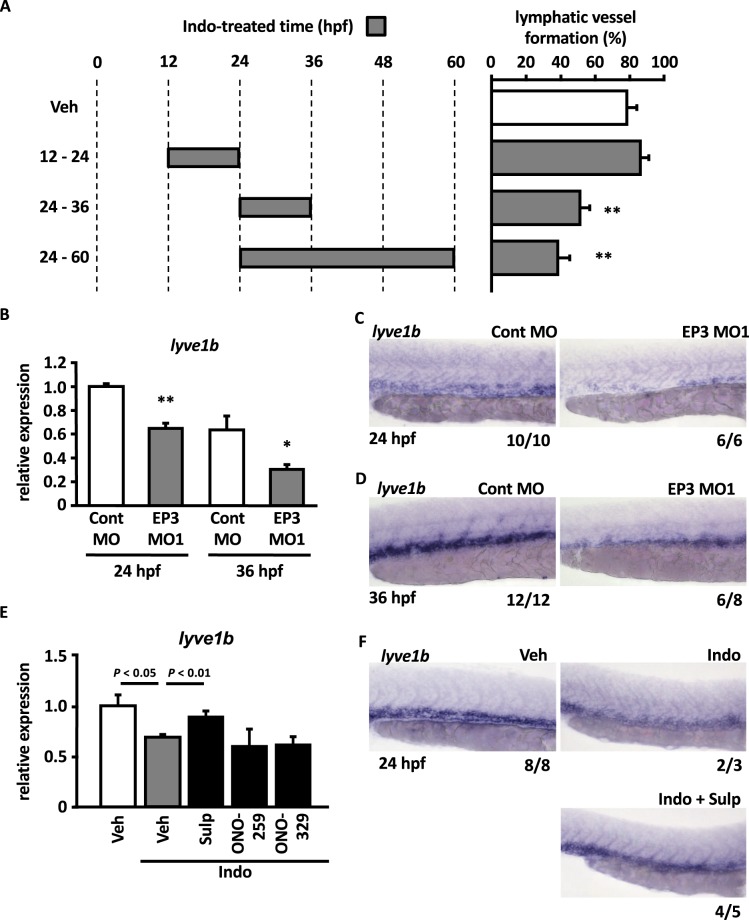
- Iwasaki et al., 2019 - Essential role of prostaglandin E2 and the EP3 receptor in lymphatic vessel development during zebrafish embryogenesis
- All Figures
- Figures for Iwasaki et al., 2019
|
Figure 2
Role of the PGE2-EP3 pathway in the lymphatic specification from venous to lymphatic endothelial cells. (