IMAGE

Figure 6

ID
ZDB-IMAGE-190723-302
Genes
Source
Figures for Iwasaki et al., 2019
Image
Figure Caption

Figure 6

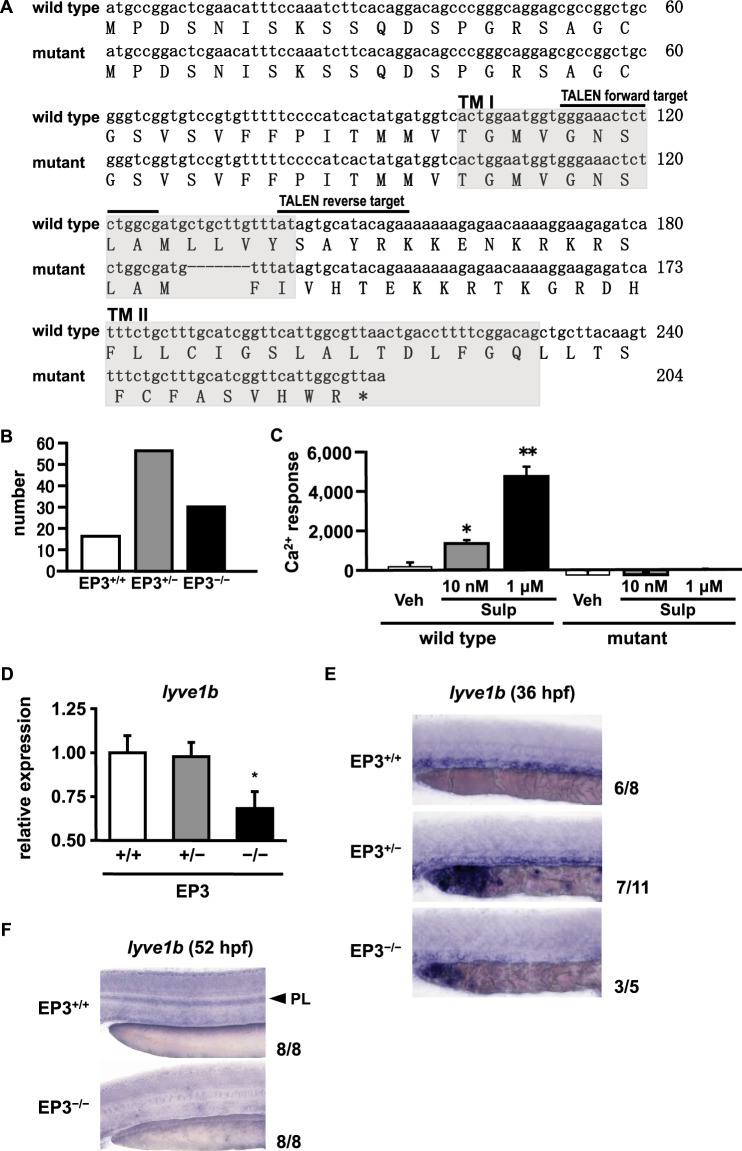
Effect of EP3 receptor deficiency on lymphatic specification and development. (A) Sequence alignment of the wild-type and mutant EP3 receptor. The seven base-pair deletion in mutant EP3 receptor is indicated by a dotted line. Transmembrane (TM) regions of the wild-type EP3 receptor are indicated by gray boxes. (B) Number of live births of EP3+/+, EP3+/−, and EP3−/− zebrafish. (C) HeLa cells were transfected with an expression vector encoding either the wild-type or mutant EP3 receptor. After 24 h, cells were incubated with loading buffer for 1 h and then treated with Veh or Sulp. Induced intracellular Ca2+ mobilization was evaluated by AUC analysis. *P < 0.05, **P < 0.01 vs Veh. Each value represents the mean ± SEM (N = 3). (D) Relative expression levels of lyve1b were quantified by RT-qPCR in EP3+/+, EP3+/−, and EP3−/− zebrafishs at 24 hpf. Values are shown relative to the value obtained with EP3+/+. Each value represents the mean ± SEM (N = 8–12) *P < 0.05 vs EP3+/+. (E) Expression of lyve1b was analyzed by WISH in EP3+/+, EP3+/−, and EP3−/− zebrafish at 36 hpf. (F) Expression of lyve1b was analyzed by WISH in EP3+/+ and EP3−/− zebrafish at 52 hpf. The PL is indicated by an arrowhead. The number at the bottom right of each panel indicates the number of embryos demonstrating the phenotype shown in the panel over the total number of embryos analyzed in a representative experiment.

Figure Data
Acknowledgments
This image is the copyrighted work of the attributed author or publisher, and ZFIN has permission only to display this image to its users. Additional permissions should be obtained from the applicable author or publisher of the image. Full text @ Sci. Rep.