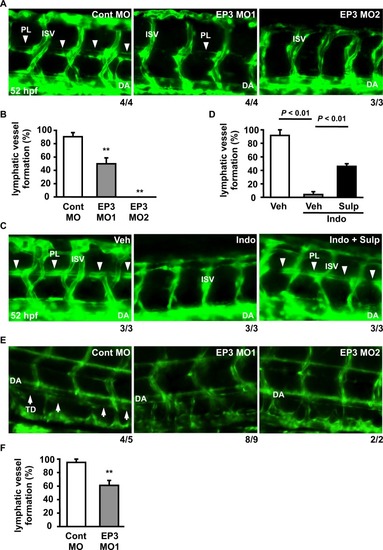
Role of the PGE2-EP3 pathway in lymphatic vessel formation. (A) Tg(fli1a:egfp) embryos were injected with Cont MO, EP3 MO1, or MO2. Images of the trunks were taken at 52 hpf. (B) The ratio of PL-positive segments in nine consecutive segments of (A) was quantitated. Each value represents the mean ± SEM (N = 3–4). (C) Tg(fli1a:egfp) embryos were treated with vehicle (Veh) or indomethacin (Indo; 100 μM) in the absence or presence of sulprostone (Sulp; 1 μM) from 0 to 52 hpf. Images were taken at 52 hpf. (D) The ratio of PL-positive segments in nine consecutive segments of (C) was quantitated. Each value represents the mean ± SEM (N = 3). (E) Tg(fli1a:egfp) embryos were injected with Cont MO, EP3 MO1, or EP3 MO2. Images of the trunks were taken at 5 dpf. (F) The ratio of TD-positive segments in eight consecutive segments of Cont MO- or EP3 MO1-injected morphants was quantitated. Each value represents the mean ± SEM (N = 5–9). **P < 0.01 vs Cont MO. DA: dorsal aorta; ISV: intersomitic vessel; PL: parachordal lymphangioblast; TD: thoracic duct. The PL is indicated by arrowheads, and the TD is indicated by arrows. The number at the bottom right of each panel indicates the number of embryos demonstrating the phenotype shown in the panel over the total number of embryos analyzed in a representative experiment.
|
