
- Title
-
Sox3 regulates both neural fate and differentiation in the zebrafish ectoderm
- Authors
- Dee, C.T., Hirst, C.S., Shih, Y.H., Tripathi, V.B., Patient, R.K., and Scotting, P.J.
- Source
- Full text @ Dev. Biol.
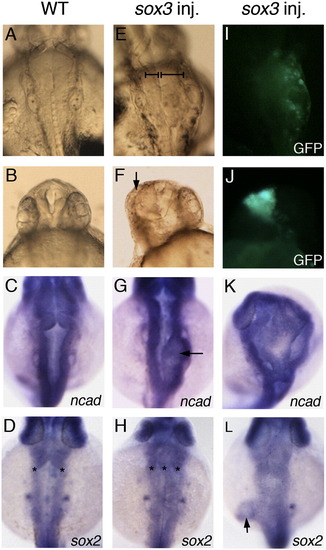
Sox3 over-expression causes expansion of neural tissue. Wild-type control embryos (A–D) and embryos injected with sox3 mRNA at 16–32 cell stage (E–L) are viewed dorsally aged 24 hpf. (E, I) Injection of sox3 mRNA causes development of extra neural tissue visible in the live embryo (bars indicate unaffected and expanded sides of the CNS, E), and GFP fluorescence indicates this occurs in the region expressing exogenous sox3 (I). (F, J) Live embryo showing over-expression of sox3 causing loss of eye (arrow, F) when expressed in the rostral region of the CNS seen by GFP fluorescence (J). (C, D, G, H, K, L) In situ hybridisation for expression of neural markers ncad or sox2 in wild-type embryos (C, D) and embryos injected with sox3 mRNA (G, H, K, L) shows the development of ectopic tissue either within the brain (arrow, G; asterisks indicate multiple neural epithelia in panel H, 16/68 embryos), expansion of the brain (K, 2/21) or expansion of a local region of the trunk (arrow, L, 4/47). EXPRESSION / LABELING:
|

Sox3 over-expression causes expansion of the neural plate. All embryos are viewed from the dorsal side at the 3-somite stage. Markers for in situ hybridisation are indicated. (A–F) Wild-type controls. (G–L) Embryos co-injected with sox3 mRNA and GFP mRNA (lineage tracer) at 16–32 cell stage. (M–R) The same embryos immunostained to detect the GFP protein (red colour). Sox3 over-expression causes neural plate markers ncad and sox2 to expand locally (G, M, 29/47 embryos, H, N, 32/39). Markers of the neural crest; foxd3 (I, O, 12/30) and snai1b (J, P, 22/39) and pre-placodal ectoderm; pax2a (K, Q, 14/30) and pax8 (L, R, 16/32) are displaced laterally. EXPRESSION / LABELING:
|

Over-expression of Sox3 can cause duplications of the CNS. (A–F) Dorsal view of embryos at the 3 somite stage. (A, D) Control wild-type embryos showing expression of neural crest markers foxd3 (A) and snai1b (D) flanking the neural plate. (B, E) Embryos injected with sox3 mRNA (and GFP mRNA lineage tracer) at the 16–32 cell stage can generate a partial second axis flanked by foxd3 (B, 4/30 embryos) or snai1b (E, 2/39) expression. Immunostaining for GFP (red colour) shows this to correspond to the injected region (C, F). (G–Q) Embryos viewed dorsally aged 24 hpf. (G, J, M, P) Wild-type control embryos. (G–L) In situ hybridisation for the expression of neural markers ncad (G–I) and sox2 (J–L) reveals that injection of sox3 mRNA at 16–32 cell stage can cause duplications of the CNS in the head (H, 2/21, K, 5/47) or tail (I, 3/21, L, 14/47). (M–Q) Duplications are also seen of the hindbrain marker krox20 (M–O, red colour, arrows indicate duplication, 8/43), the floor plate marker shha (M–O, blue colour) and pax2a which is expressed at the midbrain/hindbrain boundary (arrows, P, Q). EXPRESSION / LABELING:
|
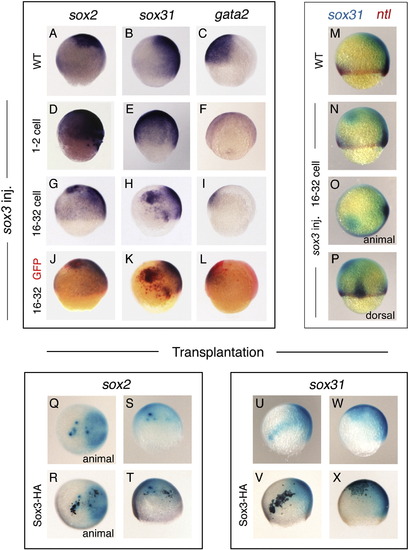
Sox3 promotes neural fate in the early ectoderm. Lateral view of mid-gastrula embryos with dorsal to the right unless otherwise indicated. The prospective neural fate markers sox2 and sox31, and the prospective non-neural fate marker gata2 detected by in situ hybridisation are indicated at the top of panels. (A–C) Control wild-type embryos. (D–F) Injection of embryos with sox3 mRNA at the 1–2 cell stage causes expansion of the prospective neural ectoderm marked by sox2 (D, 42/77 embryos) and sox31 (E, 29/48) and loss of prospective non-neural ectoderm marked by gata2 (F, 13/29). (G–I) Injection of sox3 mRNA (with GFP mRNA lineage tracer) at the 16–32 cell stage causes ectopic expression of sox2 (G, 39/76) and sox31 (H, 13/24) and repression of gata2 (L, 41/76) in the injected region. (J–L) Immunostaining for GFP reveals the ectopic Sox3 expressing region (red colour). (M–P) Double in situ hybridisation for the expression of sox31 (blue) and ntl (red, appears brown when overlapping with blue stain). (M) Control wild-type embryo. (N–P) Lateral, animal pole and dorsal view of the same sox3 (16–32 cell) injected embryo. Ectopic sox31 is induced whilst the mesoderm marker ntl is unaffected (15/57). (Q–X) Views of wild-type embryos in which donor cells (dark brown) over-expressing HA-tagged Sox3 were transplanted to the animal pole at oblong stage. Transplanted, Sox3-expressing cells exhibit ectopic expression of the neural markers sox2 (Q–T, 5/5) and sox31 (U–X, 7/7) in a cell autonomous manner. Staining of embryos with anti-HA (dark brown) reveals the position of the transplanted cells (R, T, V, X) showing they are coincident with the ectopic marker expression. EXPRESSION / LABELING:
|

Sox3 expression is inhibited by MO injection. (A) Sequence of sox3 5′UTR with MO binding sites labelled. Start codon indicated in bold and the positions of control MO mis-matches are indicated by asterisks. (B) Sections taken from the head of 24 hpf embryos and stained with anti-Sox3 and DAPI. A profound reduction of Sox3 protein expression is seen in embryos co-injected with sox3MO1/2 as compared to wild-type controls. (C) Co-injection of sox3MO1/2 blocked translation of a co-injected sox3-GFP fusion containing the MO target sequence as assayed by GFP fluorescence examined at 50% epiboly but had no effect on GFP alone. (D) Extent of knock-down of GFP fusions assayed by Western blot to detect the GFP protein. Actin was used as a loading control for the Western blot. Injection of sox3MO1 or sox3MO2 individually can be seen to knock-down sox3 translation less effectively than when used in combination. Control MOs (sox3mmMO1/2) could not block translation of sox3-GFP. |
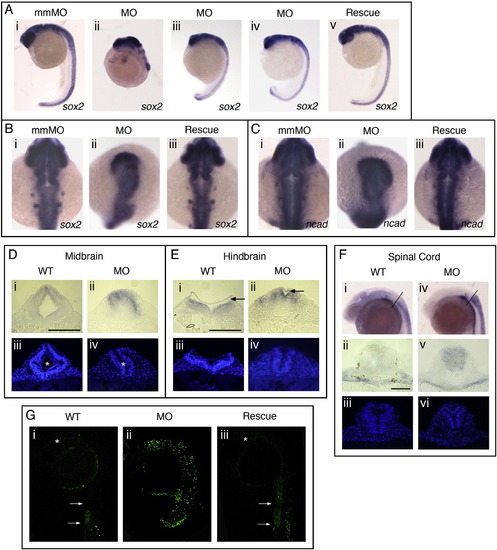
Sox3 knock-down causes reduced neural tissue in the CNS. (A–C) In situ hybridisation of 24 hpf embryos showing the expression of the neural markers sox2 (A, B) and ncad (C). (A) Lateral views. (B, C) Dorsal views. Embryos injected with mis-match control MOs (mmMOs) are indistinguishable from wild-type (Ai, Bi, Gi). Injection of sox3MOs causes severe loss of neural structures in the brain and loss of caudal tissues (Aii: 25/307, Aiii: 135/307, Aiv: 67/307) and the remaining neural tissue of the head is disorganised but continues to express sox2 (Bii) and ncad (Cii) strongly. The MO phenotype is rescued by co-injection with sox3 mRNA (Aiii, Biii, Ciii: 91/113). (D, E) Transverse sections cut in the midbrain (D) and hindbrain (E) viewed under white light (Di, Dii, Ei, Eii) or DAPI stain (Diii, Div, Eiii, Eiv) showing loss of lumen (indicated by asterisk, Diii, iv) and reduced hindbrain (roof plate indicated by arrow, Ei, ii) in sox3 morphant embryos. (F) Transverse section cut of the spinal cord of control (Fi–iii) or morphant (Fiv–vi) embryos viewed under white light (Fi, ii, iv, v) or DAPI stain (Fiii, iv). (Fi, iv) Lateral view of embryos showing position where sections were taken. Scale bars are equal to 100 μm (Di, Ei) or 50 μm (Fii). (G) Fluorescent images of TUNEL stained 24 hpf embryos, lateral views. Significant fluorescent signal in morphant embryos (Gii, 11/11 compares to phenotype in Aiii) shows increased apoptosis compared to wild-type controls (Gi). MO-induced apoptosis is rescued by co-injection with sox3 mRNA (Giii, 11/13). Position of the brain is marked by asterisks and the arrows indicate ventral edge of the tail in wild-type and rescue embryos (Gi, iii). |
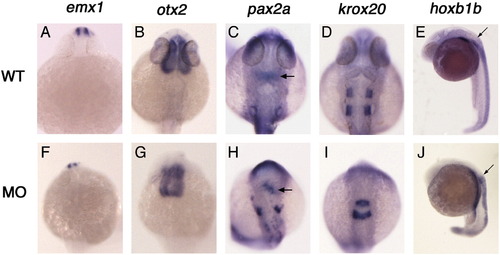
Sox3 knock-down does not affect rostrocaudal patterning of the CNS. Control (A–E) and sox3 morphant (F–J) embryos were stained for the expression of positional markers of the developing brain and spinal cord. Expression of positional markers is maintained in morphant embryos despite severe disruption of CNS tissue. Markers used are emx1 (A, F, 42/49 embryos), otx2 (B, G, 10/10), pax2a (arrows indicate midbrain/hindbrain boundary; C, H, 19/22), krox20 (D, I, 14/14) and hoxb1b (arrows indicate rostral limit of CNS expression; E, J, 23/23). All embryos are aged 24 hpf and dorsal view except for panels E and J which are lateral view. |

Sox3 is required for neuronal differentiation. (A–O) Dorsal view of in situ hybridised embryos aged 24 hpf unless otherwise indicated in the panel. Wild-type embryos (A–E) were analysed for the expression of several markers of differentiating neurons (marker genes indicated to the left of panels) and compared to morphant embryos (F–J) and embryos injected with sox3 mRNA at the 16–32 cell stage (K–O). (F–J) Morphant embryos show significant disruption of all markers analysed. These are ngn1 (F, 27/42 embryos), phox2a (G, 37/51), elavl3 (H, 9/11), elavl4 (I, 6/23) and nefm (J, 16/21). (K–O) Sox3 over-expression causes disruption of phox2a expression (L, indicated by asterisk), but does not disrupt the expression of the other markers analysed, ngn1 (K, 9/32), elavl3 (M, 15/39), elavl4 (N, 14/28) and nefm (O, 3/19), which are all expressed strongly in regions of ectopic neural tissue induced by Sox3 (indicated by arrows). (P–W) View of wild-type (P–S) and sox3 (16–32 cell) injected (T–W) embryos aged 18 hpf (P, T, S, W viewed laterally; Q, U, R, V viewed dorsally). As at 24 hpf, Sox3 over-expression at this stage causes disruption of phox2a (U, 11/36), whilst ngn1 (T, 9/38), elavl3 (V, 18/39) and elavl4 (W, 6/26) are expressed strongly in ectopic tissue (arrows). (X) Western blot using anti-HA showing that exogenous Sox3 protein has decreased dramatically by 18 hpf and is completely absent by 24 hpf. EXPRESSION / LABELING:
PHENOTYPE:
|
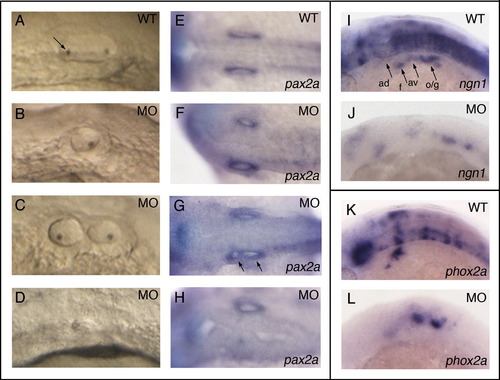
Sox3 knock-down causes abnormal development of the ear and cranial placodes. All embryos are aged 24 hpf. Otic vesicles of control (A, arrow indicates otolith) and sox3 morphant (B–D) embryos showing reduced (B, 25/49 embryos), split (C, 10/49), or absent vesicles (D, 14/49). (E–H) In situ hybridisation of control (E) and sox3 morphant (F–H) embryos viewed dorsally showing otic vesicles marked by the expression of pax2a again showing reduced (F), split (arrows, G) or absent (H) vesicles. (I, J) Lateral view showing placodal expression of ngn1 in control (I) and sox3 morphant embryos (J, 27/42). (K, L) Lateral view showing expression of phox2a in the epibranchial placodes of control (K) and sox3 morphant (L, 37/51) embryos. Expression of both ngn1 and phox2a is severely disrupted in the placodes of morphant embryos (J, L). ad, anterodorsal lateral line; av, anteroventral lateral line; f, facial; o/g, octaval/statoacoustic/glossopharyngeal. |
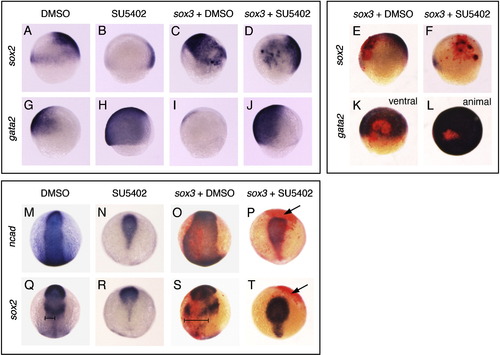
Sox3 can expand neural fate in the early ectoderm in the absence of Fgf signalling, but requires Fgf to maintain neural fate at later stages. (A–L) Lateral view of mid-gastrula stage embryos except for (K: Ventral view) and (L: Animal pole view). (A, G) Control embryos treated with DMSO only as a negative control for SU5402, showing expression of the prospective neural marker sox2 (A) and the prospective non-neural marker gata2 (G). Treatment with the Fgf inhibitor, SU5402, causes repression of sox2 (B, 37/37 embryos) and expansion of gata2 (H, 16/16). Injection of either DMSO treated (C, I) or SU5402 treated (D, J) embryos with sox3 mRNA at the 1–2 cell stage caused expansion of sox2 (C, 18/18; D, 14/19) and repression of gata2 (I, 7/17; J, 15/25). Injection of embryos with sox3 mRNA (and GFP mRNA lineage tracer) at the 16–32 cell stage caused ectopic expression of sox2 in a proportion of the sox3 over-expressing cells (E, 7/7; F, 21/25) and repression of gata2 (K, 5/5; L, 9/17) in embryos treated with either DMSO (E, K) or SU5402 (F, L). (E–F, K–L) Immunostaining of embryos for GFP (red colour) indicates the sox3 over-expressing region. (M–T) Embryos at the 3 somite stage viewed dorsally. (M, Q) DMSO treated control embryos showing expression of neural markers ncad (M) and sox2 (Q). (N, R) SU5402 treatment causes repression of neural markers leaving only a small rostral region of neural plate. Injection of sox3 mRNA (and GFP mRNA) at the 16–32 cell stage causes expansion of the neural plate (O, 19/20; S, 9/9) in DMSO treated embryos (bars in panels Q and S indicate the expansions of the neural plate), but by this stage has no effect on the expression of neural markers in SU5402 treated embryos (P, 25/25; T, 15/15). Arrows (P, T) indicate the region expression exogenous Sox3 (red), showing that the neural markers ncad and sox2 are absent from this region. EXPRESSION / LABELING:
|
Reprinted from Developmental Biology, 320(1), Dee, C.T., Hirst, C.S., Shih, Y.H., Tripathi, V.B., Patient, R.K., and Scotting, P.J., Sox3 regulates both neural fate and differentiation in the zebrafish ectoderm, 289-301, Copyright (2008) with permission from Elsevier. Full text @ Dev. Biol.