
- Title
-
The Polycomb group gene rnf2 is essential for central and enteric neural system development in zebrafish
- Authors
- Feng, G., Sun, Y.
- Source
- Full text @ Front. Neurosci.

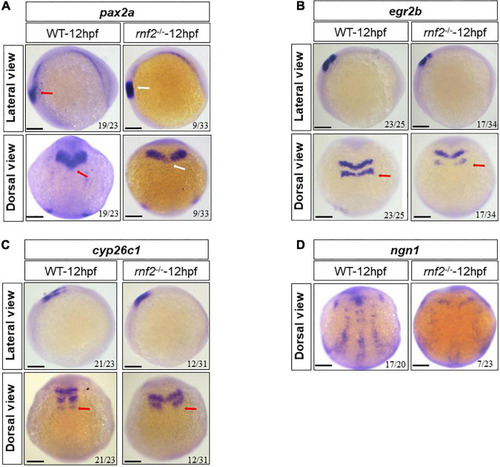
Expression patterns of EXPRESSION / LABELING:
|
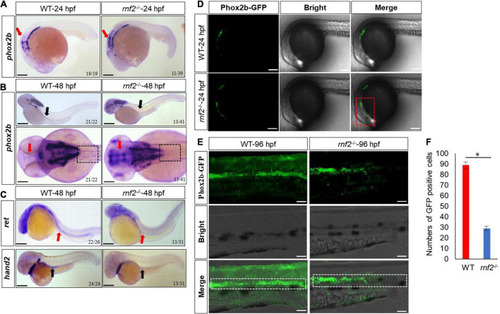
The effect of |
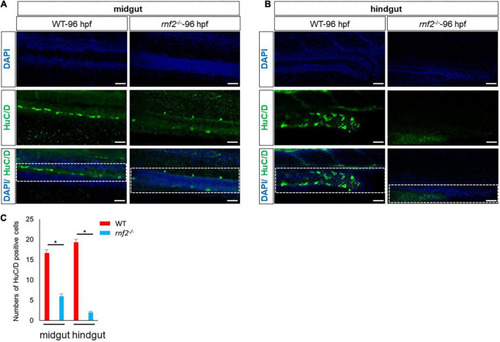
The deficiency of PHENOTYPE:
|
The effect of loss of EXPRESSION / LABELING:
PHENOTYPE:
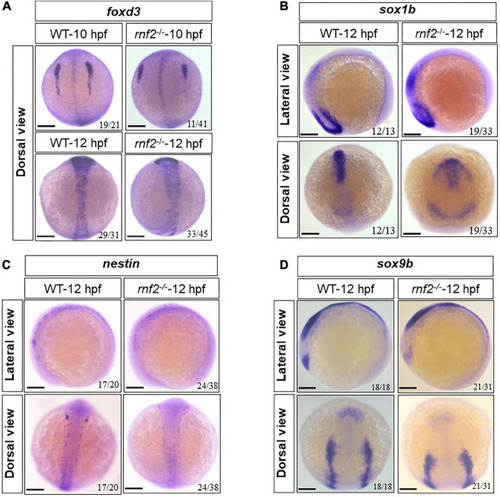
|

The effect of EXPRESSION / LABELING:
PHENOTYPE:
|
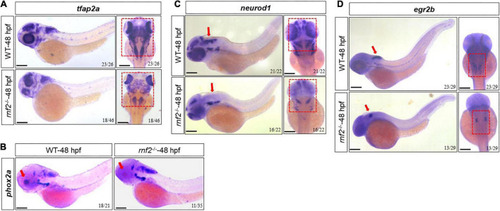
The effect of |
The effect of EXPRESSION / LABELING:
PHENOTYPE:
|
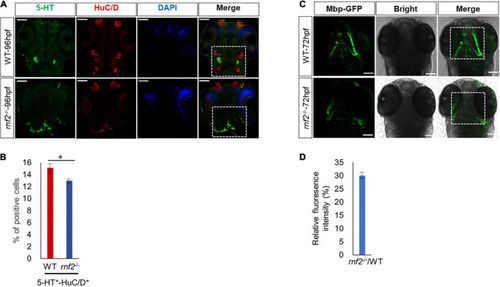
Loss of Rnf2 leads to neuronal differentiation defects in zebrafish embryos. PHENOTYPE:
|