
- Title
-
Smad4 controls signaling robustness and morphogenesis by differentially contributing to the Nodal and BMP pathways
- Authors
- Guglielmi, L., Heliot, C., Kumar, S., Alexandrov, Y., Gori, I., Papaleonidopoulou, F., Barrington, C., East, P., Economou, A.D., French, P.M.W., McGinty, J., Hill, C.S.
- Source
- Full text @ Nat. Commun.
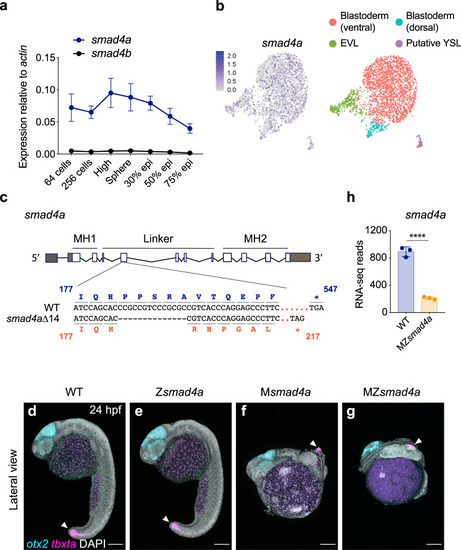
smad4a is expressed during early zebrafish development and its loss disrupts embryo patterning.
a qPCR for smad4a and smad4b mRNA in WT embryos, at the stages indicated. Means ± SEM are shown for four biological replicates for each stage. b Uniform manifold approximation and projection (UMAP) visualization of single cells derived from sphere stage zebrafish embryos. Left panel, normalized counts for smad4a expression. Right panel, unsupervised clustering subdivides the sphere sample in four different clusters. c Schematic representation of the smad4a locus and CRISPR/Cas9 editing strategy, with WT and the mutant DNA and protein sequences. d–g Lateral views of 24-hpf WT (d), Zsmad4a (e), Msmad4a (f), and MZsmad4a (g) embryos double FISH-stained for otx2 and tbxta. Images in d–g are representative of 25 embryos each and four independent experiments. Scale bar corresponds to 150 µm and arrow indicates the tailbud. Nuclei were stained with DAPI (white). h RNA-seq reads for smad4a in WT and MZsmad4a mutants. Means ± SD are shown for three biological replicates for each genotype. p(adj) = 2.132 × 10⁻³⁵. Wald test. ****, p(adj) < 0.0001. |
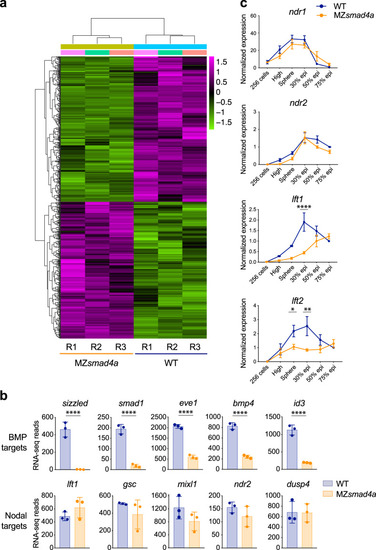
BMP-dependent transcription is abolished in MZsmad4a mutants, while Nodal target gene expression is maintained.
a RNA-seq on WT and MZsmad4a embryos performed in triplicate. In the heatmap the color legend shows scaled RLog transformed expression counts for each replicate. b RNA-seq reads for representative BMP (upper panel) and Nodal (bottom panel) target genes in WT and MZsmad4a embryos. The data are means ± SD from three biological replicates for each genotype. sizzled: p(adj) = 4.699 × 10-78, smad1: p(adj) = 9.253 × 10⁻²³, eve1: p(adj) = 1.581 × 10⁻²⁷, bmp4: p(adj) = 2.183 × 10⁻²³, id3: p(adj) = 2.445 × 10-48. Wald test. ****p(adj) < 0.0001. c qPCR for ndr1/2 and lft1/2 in WT and MZsmad4a embryos at the indicated stages. Normalized values are shown as means ± SEM. For ndr1/2, the data are the result of three biological replicates while for lft1/2 they are the result of four biological replicates, except for lft1 in MZsmad4a embryos at sphere stage and lft2 in WT embryos at 30% epiboly, which are the result of three biological replicates. lft1 30% epiboly: p(adj) = 4389 × 10-5, lft2 sphere: p(adj) = 0.046, lft2 30%: p(adj) = 0.002. Unpaired multiple comparison t-test with Holm-Sidack correction. *p < 0.05; **p < 0.01; ****p < 0.0001. EXPRESSION / LABELING:
PHENOTYPE:
|
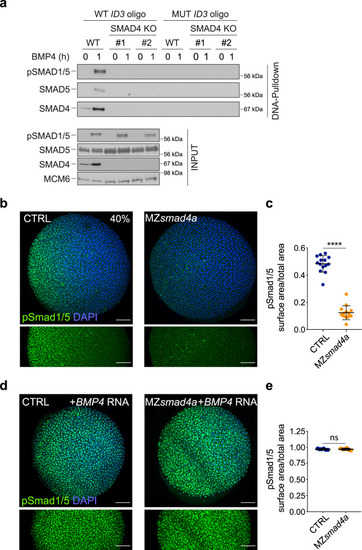
BMP/pSmad1/5 activity is lost in MZsmad4a mutants but can be rescued by ectopic BMP ligand expression.
a WT HaCaT cells and two clones of SMAD4 knockout (KO) HaCaT cells were treated or not with BMP4. DNA pulldowns from whole cell extracts were performed using an oligonucleotide containing the SMAD1/5–SMAD4 binding sites of the upstream ID3 enhancer, or a version in which these sites were mutated. Pulldowns were immunoblotted with the indicated antibodies and inputs are shown below. The immunoblot is representative of three independent experiments. Molecular weight markers are given in kDa on the right of the blots. b Immunostaining for pSmad1/5 (green) in 40% epiboly CTRL and MZsmad4a embryos. Nuclei are stained with DAPI (blue). The bottom panel highlights the pSmad1/5 gradient without the DAPI channel. Scale bars correspond to 100 µm. Animal views are shown. c Quantitation of the pSmad1/5 gradient size with respect to the embryo surface. 14 embryos for each group are represented as means ± SD. p = 4.985 × 10⁻⁸. Two sided Mann–Whitney test. ****p < 0.0001. d As in b but showing CTRL and MZsmad4a embryos injected with 60 pg of hBMP4 mRNA. Scale bars correspond to 100 µm. e Quantitation of hBMP4 mRNA-injected CTRL and MZsmad4a embryos. Six embryos for each group are represented as means ± SD. Two sided Mann–Whitney test. ns not significant. EXPRESSION / LABELING:
PHENOTYPE:
|
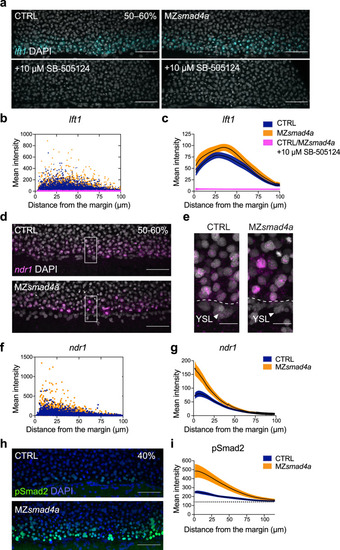
The Nodal–pSmad2 signaling gradient forms independently of Smad4a.
a Maximum intensity projection (MIP) of quantitative ISH for lft1 at mid gastrulation (50–60% epiboly) in CTRL and MZsmad4a embryos treated ±10 µM SB-505124 at sphere stage. Scale bars correspond to 80 µm. Lateral views are shown. Nuclei were stained with DAPI (white). b Quantitation of a. Orange, dark blue, and magenta dots show segmented cells from CTRL and MZsmad4a embryos treated ±10 µM SB-505124. n = 8 embryos for each group. c Curve fitting for segmented cell intensities shown in b. Means are shown by black lines and the orange/dark blue shading indicates the SEMs. d, e MIP of quantitative ISH for ndr1 in CTRL and MZsmad4a embryos at mid-gastrulation (50–60% epiboly). Regions indicated in d by white boxes are shown enlarged in e. Scale bars correspond to 80 µm in d and 20 µm in e. Arrowheads indicate YSL. Lateral views are shown. Nuclei were stained with DAPI (white). f Quantitation of d. Orange and dark blue dots show segmented cells from CTRL and MZsmad4a embryos. n = 8 embryos for each group. g Curve fitting for segmented cell intensities shown in f. Means are shown by black lines and the orange/dark blue shading indicates the SEMs. h MIP of CTRL and MZsmad4a at 40% epiboly, immunostained for pSmad2. Scale bar corresponds to 80 µm. Lateral views are shown. Nuclei were stained with DAPI (blue). i Quantitation of the pSmad2 immunostaining at the margin of CTRL and MZsmad4a embryos. Each trace represents n = 8 embryos. Means are shown by black lines and the orange/dark blue shading indicates the SEMs. Dotted line shows baseline. EXPRESSION / LABELING:
PHENOTYPE:
|
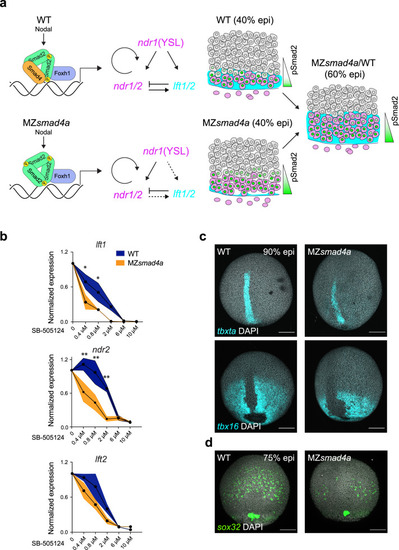
Nodal-independent signaling is sensitized but is sufficient for mesoderm induction.
a Model of Nodal signaling gradient formation in WT and MZsmad4a mutant embryos. In contrast to WT (upper panel), in MZsmad4a embryos (lower panel) a homomeric trimer of activated pSmad2 can still be recruited to chromatin via Foxh1, but with reduced efficiency. Consequently, some Nodal target genes, in particular, lft1/2 are initially inefficiently transcribed. As Nodal induction of Ndr1/2 is not inhibited by Lft1/2, this leads to higher premature induction of the Nodal–pSmad2 signaling gradient. By 60% epiboly, once Lft1/2 levels have reached those equivalent to WT, the signaling gradient in MZsmad4a mutant embryos has adjusted to WT-like levels. b Dose responses of SB-505124 for lft1/2 and ndr2 in WT and MZsmad4a embryos, treated with inhibitor at sphere stage. The dose marked 0 corresponds to DMSO. Black dots represent the mean for three biological replicates for each dose and each genotype. Orange shading indicates the SEM. lft1 0.4 µM: p(adj) = 0.012, lft1 0.8 µM: p(adj) = 0.036, ndr2 0.4 µM: p(adj) = 0.005, ndr2 0.8 µM: p(adj) = 0.003, ndr2 2 µM: p(adj) = 0.003. Unpaired multiple comparison t-test with Holm-Sidack correction. *p < 0.05; **p < 0.01. c Upper panel: MIP of ISH for tbxta (cyan) in CTRL and MZsmad4a embryos at 90% epiboly (epi). Bottom panel: MIP of ISH for tbx16 (cyan) at 90% epiboly. Nuclei are stained with DAPI (white). Scale bars correspond to 150 µm. Dorsal views are shown. d MIP of ISH for sox32 (green) in CTRL and MZsmad4a embryos at 75% epiboly. Nuclei are stained with DAPI (white). Scale bars correspond to 150 µm. Dorsal views are shown. Images in c, d are representative of 25 embryos each and three independent experiments, except for the tbx16 ISH, which is the result of two independent experiments. EXPRESSION / LABELING:
PHENOTYPE:
|
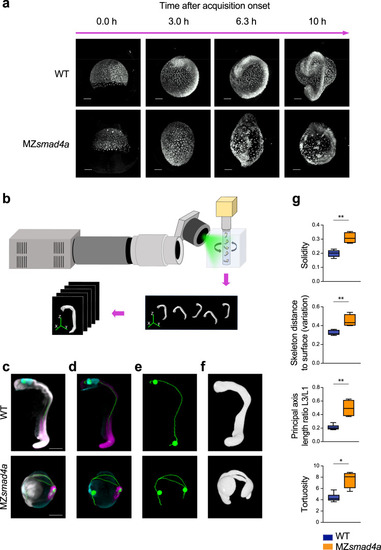
An OPT pipeline enabling fast quantitation of 24-hpf zebrafish embryos.
a Snapshots from Supplementary Movies 1 and 2, showing WT and MZsmad4a embryo development. Upper and lower panels show developing WT and MZsmad4a mutant embryos, respectively. Embryos are shown at 0.0 (mid gastrulation), 3.0, 6.3, and 10 h after acquisition onset. Nuclei were mosaically labeled with PSmOrange. Scale bar corresponds to 150 µm. b Schematic of the OPT set up, where up to five embryos can be imaged simultaneously. A 5-channel image is generated for each embryo for subsequent quantitation. c–f Examples of processed WT and MZsmad4a embryo images. Merged nuclear marker channel together with anterior (otx2) and posterior (myod) markers and digital skeleton (c). Merged anterior (otx2) and posterior (myod) markers and skeleton (d). Skeleton channel, together with anterior/posterior landmarks (e). Green spheres along the skeleton mark A/P coordinates. Segmented embryo mask representative of the nuclear marker (f). Scale bars correspond to 260 µm. g A subset of morphological descriptors from the output array (4 out of 26). Note that all measures, beside the A/P index, refer to the segmented embryo mask. Box-and-whiskers plots show WT (n = 6) vs MZsmad4a mutants (n = 4). Box at 25–75th percentile, whiskers at minimum and maximum values, line at median. Solidity: p = 0.009, Skeleton distance to surface (variation): p = 0.009, Tortuosity p = 0.019, Principal axis length ratio L3/L1: p = 0.009. Two sided Mann–Whitney test. *p < 0.05; **p < 0.01. EXPRESSION / LABELING:
PHENOTYPE:
|
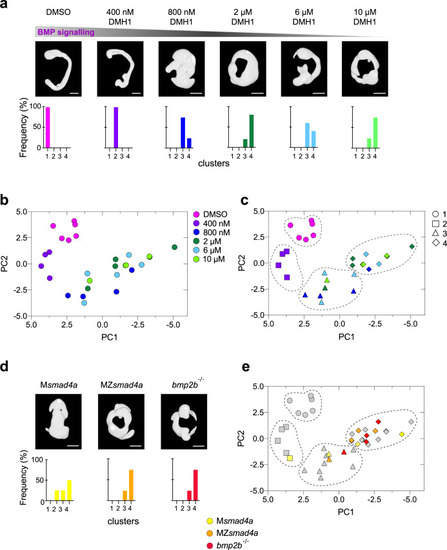
Building a morphometric map for BMP signaling.
a Representative embryos treated with different doses of the BMP inhibitor DMH1 are shown. Bottom panels show the percentage of embryos falling in the different severity clusters defined in c. Scale bars correspond to 260 µm. b Morphometric map for the BMP dose/response. Each embryo is represented as a dot and color coding indicates the DMH1 dose. c As in b, but using hierarchical clustering, which defines four different clusters with different severity. Color coding indicates DMH1 dose; shapes indicate severity groups. d As in a but shows embryo masks for MZsmad4a, Msmad4a, and bmp2b-/- embryos. Scale bars correspond to 260 µm. e MZsmad4a (orange), Msmad4a (yellow), and bmp2b-/- (red) are plotted onto the dose/response morphometric map (gray). Shapes indicate severity group. EXPRESSION / LABELING:
PHENOTYPE:
|