
Fig. 2
- ID
- ZDB-FIG-211118-35
- Publication
- Guglielmi et al., 2021 - Smad4 controls signaling robustness and morphogenesis by differentially contributing to the Nodal and BMP pathways
- Other Figures
- All Figure Page
- Back to All Figure Page
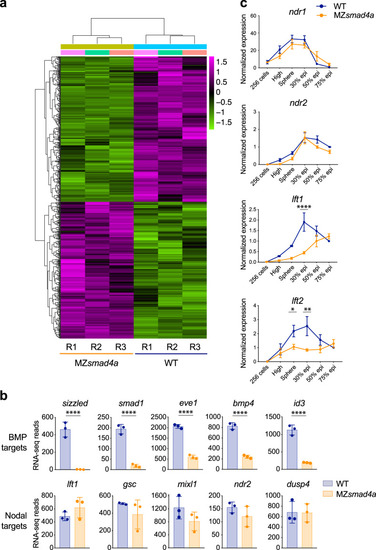
BMP-dependent transcription is abolished in MZsmad4a mutants, while Nodal target gene expression is maintained.
a RNA-seq on WT and MZsmad4a embryos performed in triplicate. In the heatmap the color legend shows scaled RLog transformed expression counts for each replicate. b RNA-seq reads for representative BMP (upper panel) and Nodal (bottom panel) target genes in WT and MZsmad4a embryos. The data are means ± SD from three biological replicates for each genotype. sizzled: p(adj) = 4.699 × 10-78, smad1: p(adj) = 9.253 × 10⁻²³, eve1: p(adj) = 1.581 × 10⁻²⁷, bmp4: p(adj) = 2.183 × 10⁻²³, id3: p(adj) = 2.445 × 10-48. Wald test. ****p(adj) < 0.0001. c qPCR for ndr1/2 and lft1/2 in WT and MZsmad4a embryos at the indicated stages. Normalized values are shown as means ± SEM. For ndr1/2, the data are the result of three biological replicates while for lft1/2 they are the result of four biological replicates, except for lft1 in MZsmad4a embryos at sphere stage and lft2 in WT embryos at 30% epiboly, which are the result of three biological replicates. lft1 30% epiboly: p(adj) = 4389 × 10-5, lft2 sphere: p(adj) = 0.046, lft2 30%: p(adj) = 0.002. Unpaired multiple comparison t-test with Holm-Sidack correction. *p < 0.05; **p < 0.01; ****p < 0.0001. |
| Genes: | |
|---|---|
| Fish: | |
| Anatomical Term: | |
| Stage Range: | 256-cell to 75%-epiboly |
| Fish: | |
|---|---|
| Observed In: | |
| Stage Range: | 256-cell to 75%-epiboly |