
Fig. 4
- ID
- ZDB-FIG-211118-37
- Publication
- Guglielmi et al., 2021 - Smad4 controls signaling robustness and morphogenesis by differentially contributing to the Nodal and BMP pathways
- Other Figures
- All Figure Page
- Back to All Figure Page
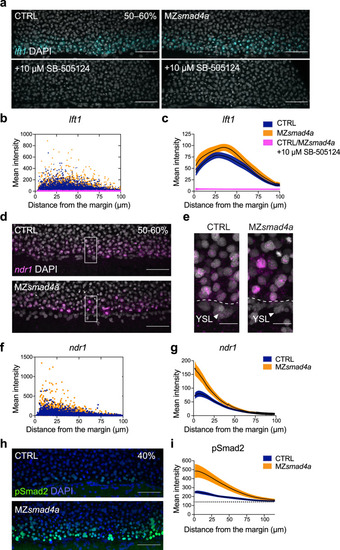
The Nodal–pSmad2 signaling gradient forms independently of Smad4a.
a Maximum intensity projection (MIP) of quantitative ISH for lft1 at mid gastrulation (50–60% epiboly) in CTRL and MZsmad4a embryos treated ±10 µM SB-505124 at sphere stage. Scale bars correspond to 80 µm. Lateral views are shown. Nuclei were stained with DAPI (white). b Quantitation of a. Orange, dark blue, and magenta dots show segmented cells from CTRL and MZsmad4a embryos treated ±10 µM SB-505124. n = 8 embryos for each group. c Curve fitting for segmented cell intensities shown in b. Means are shown by black lines and the orange/dark blue shading indicates the SEMs. d, e MIP of quantitative ISH for ndr1 in CTRL and MZsmad4a embryos at mid-gastrulation (50–60% epiboly). Regions indicated in d by white boxes are shown enlarged in e. Scale bars correspond to 80 µm in d and 20 µm in e. Arrowheads indicate YSL. Lateral views are shown. Nuclei were stained with DAPI (white). f Quantitation of d. Orange and dark blue dots show segmented cells from CTRL and MZsmad4a embryos. n = 8 embryos for each group. g Curve fitting for segmented cell intensities shown in f. Means are shown by black lines and the orange/dark blue shading indicates the SEMs. h MIP of CTRL and MZsmad4a at 40% epiboly, immunostained for pSmad2. Scale bar corresponds to 80 µm. Lateral views are shown. Nuclei were stained with DAPI (blue). i Quantitation of the pSmad2 immunostaining at the margin of CTRL and MZsmad4a embryos. Each trace represents n = 8 embryos. Means are shown by black lines and the orange/dark blue shading indicates the SEMs. Dotted line shows baseline. |
| Genes: | |
|---|---|
| Antibody: | |
| Fish: | |
| Condition: | |
| Anatomical Term: | |
| Stage Range: | 50%-epiboly to Germ-ring |
| Fish: | |
|---|---|
| Condition: | |
| Observed In: | |
| Stage Range: | 50%-epiboly to Germ-ring |