
|
Fig. 1
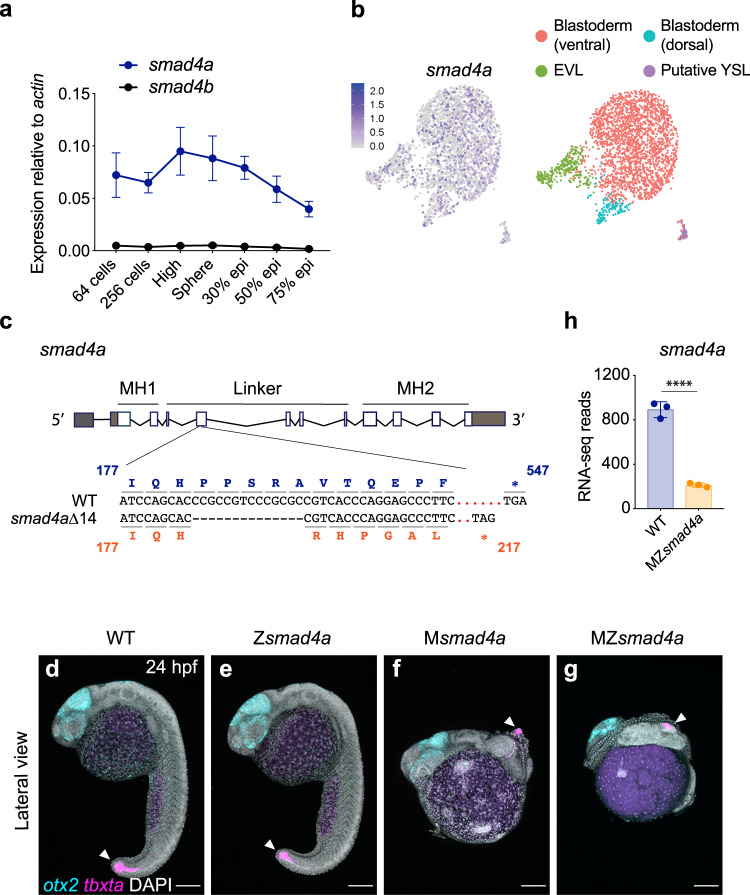
a qPCR for smad4a and smad4b mRNA in WT embryos, at the stages indicated. Means ± SEM are shown for four biological replicates for each stage. b Uniform manifold approximation and projection (UMAP) visualization of single cells derived from sphere stage zebrafish embryos. Left panel, normalized counts for smad4a expression. Right panel, unsupervised clustering subdivides the sphere sample in four different clusters. c Schematic representation of the smad4a locus and CRISPR/Cas9 editing strategy, with WT and the mutant DNA and protein sequences. d–g Lateral views of 24-hpf WT (d), Zsmad4a (e), Msmad4a (f), and MZsmad4a (g) embryos double FISH-stained for otx2 and tbxta. Images in d–g are representative of 25 embryos each and four independent experiments. Scale bar corresponds to 150 µm and arrow indicates the tailbud. Nuclei were stained with DAPI (white). h RNA-seq reads for smad4a in WT and MZsmad4a mutants. Means ± SD are shown for three biological replicates for each genotype. p(adj) = 2.132 × 10⁻³⁵. Wald test. ****, p(adj) < 0.0001.