
- Title
-
Biallelic variants in KARS1 are associated with neurodevelopmental disorders and hearing loss recapitulated by the knockout zebrafish
- Authors
- Lin, S.J., Vona, B., Barbalho, P.G., Kaiyrzhanov, R., Maroofian, R., Petree, C., Severino, M., Stanley, V., Varshney, P., Bahena, P., Alzahrani, F., Alhashem, A., Pagnamenta, A.T., Aubertin, G., Estrada-Veras, J.I., Hernández, H.A.D., Mazaheri, N., Oza, A., Thies, J., Renaud, D.L., Dugad, S., McEvoy, J., Sultan, T., Pais, L.S., Tabarki, B., Villalobos-Ramirez, D., Rad, A., Genomics England Research Consortium, Galehdari, H., Ashrafzadeh, F., Sahebzamani, A., Saeidi, K., Torti, E., Elloumi, H.Z., Mora, S., Palculict, T.B., Yang, H., Wren, J.D., Ben Fowler, ., Joshi, M., Behra, M., Burgess, S.M., Nath, S.K., Hanna, M.G., Kenna, M., Merritt, J.L., Houlden, H., Karimiani, E.G., Zaki, M.S., Haaf, T., Alkuraya, F.S., Gleeson, J.G., Varshney, G.K.
- Source
- Full text @ Genet. Med.
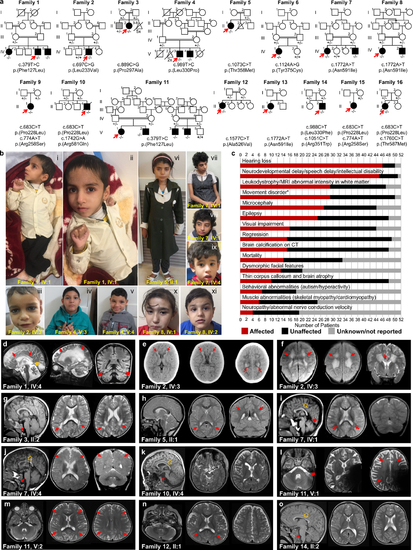
Fig. 1. Identification of pathogenic variants in KARS1 in 16 families and clinical summary. (a) Pedigrees and segregation data for the 16 families included in this study. Affected and unaffected individuals are indicated by filled and open squares (males) and circles (females), respectively. Probands are marked with red arrows. Double lines indicate consanguinity. Genetic diagnoses were made in 22 individuals. (b) Clinical characteristics of patients with homozygous KARS1 variants, including affected individuals from family 1 (IV:4) (i, ii), family 2 (IV:3) (iii), family 4 (V:3) (iv) and (V:4) (v), family 5 (II:1) (vi), family 7 (IV:1) (vii, viii) and IV:4 (ix), and family 8 (IV:1) (x) (IV:2) (xi). Frequent clinical features include: spasticity and contractures in the limbs with clenched hands (i, ii), high forehead (iv, v, vi, vii, x), prominent nose (i, ii, iv, v, vi, vii, viii), low-set ears (i, ii, iv, v, vii, viii, ix), and short philtrum (i, ii, iv, v, vi, vii, ix, x). (c) Phenotype summary of features associated with KARS1 pathogenic variants. Asterisk denotes movement disorders that include ataxia, spasticity, quadriplegia, dystonia, or chorea/tremor. (d–o) Neuroimaging features associated with KARS1 variants, with variable patterns of white matter (WM) involvement (red arrows), calcifications (red dotted arrows), pontine hypoplasia (red arrowheads), cerebellar atrophy (red thick arrows), enlargement of the cerebral cerebrospinal fluid (CSF) spaces, and corpus callosum hypoplasia (gold arrows). |

Fig. 2. Expression of kars1 messenger RNA (mRNA) in embryos and kars1 knockouts show gross morphological and behavioral defects. (a) kars1 expression in 1 days postfertilization (dpf) embryo. Dorsal view. (b,c) The cross-section of 2 dpf embryo. CMZ ciliary marginal zone, fb forebrain, hb hindbrain, le lens, mb midbrain, MHB midbrain and hindbrain boundary, ov otic vesicle, TeO optic tectum. Black arrowheads indicating the otic vesicle epithelium of otic vesicles. (d,e) Representative images of wild-type (WT) and kars1om1del7 (kars1−/−) from 1 dpf to 5 dpf. Lateral view, anterior to the left. Red lines: eye diameter. Blue lines: brain size. Red arrowheads: inner ear. Black arrows: heart edema. Black arrowhead: swim bladder. (f) Kaplan–Meier survival curves. Time is shown in days. The log rank test was used for statistical analysis. (g,h) Quantification of eye and head size from kars1+/- mutant in-cross at 3 and 5 dpf. (i,j) The visual startle response (VSR) and auditory evoked behavior response (AEBR) analyses of animals at 6 dpf from kars1+/- mutant in-cross. (k) Representative images of kars1−/− mutant rescue experiments and the quantification of heart edema phenotype. Animals were collected by defined heart edema categories at 3 dpf as shown in pictures and calculated in percentage of total animals. (l) Eye size quantification of mRNA rescue experiments at 5 dpf. (m,n) The VSR and AEBR analyses after RNA rescue at 6 dpf. n = number of animals. In (g,h,l), each dot represents one animal and error bars are presented as mean ± SD. One-way analysis of variance (ANOVA) with Tukey’s multiple comparisons test: ****p < 0.0001. In (i,j,m,n), data are plotted by box and whiskers plot and error bars indicate values from minimum to the maximum. Two-tailed unpaired t-test with Welch’s correction: ns, not significant p ≥ 0.05, *p < 0.05 and ****p < 0.0001. |

Fig. 3. The kars1−/− larvae display neurological, muscle, and inner ear defects by histological analysis at 5 dpf. (a) Head region of wild-type (WT) and kars1−/− mutant by sagittal section. Red asterisks indicate massive loss of cell density, as well as in (b) and (c). Anterior to the left and dorsal to the top. (b) Eye region of WT and kars1−/− mutant by cross-section. Dorsal to the top. (c) Inner ear region of WT and kars1−/− mutant by cross-section. Dorsal to the top. Lower panels were enlarged picture from black box. (d) Head region of WT and kars1−/− larvae immunostained with anti-znp-1 antibody. The black-and-white fluorescent signals were inverted to negative film for a clear presentation. Dorsal view, anterior to the left. on, optic nerve. (e) Trunk region of WT and kars1−/− larvae which were immunostained with anti-znp-1 antibody. ImageJ was used to measure the diameter of primary motor axons as indicated by red line in the right-down panels (enlarged from red box). Statistics are shown on the right-hand side. Black dot indicates the diameter of each motor axon. Error bars = mean ± SD. Two-tailed unpaired nonparametric Mann–Whitney test: ****p < 0.0001. Black arrowheads indicate the reduced terminal axonal branching compared to WT. Anterior to the left and dorsal to the top. (f) The trunk region of WT and kars1−/− larvae revealed by sagittal section. Anterior to the left and dorsal to the top. (g) The trunk region of WT and kars1−/− larvae revealed by confocal projections of phalloidin stained muscle fiber. Anterior to the left and dorsal to the top. The lower-right panels are the higher-magnification view. (h) Representative bright-field images of WT and kars1−/− inner ear. Anterior to the left and dorsal to the top. oto otolith, SC semicircular canal. (i) The red fluorescent conjugated phalloidin staining was performed to visualize the bundles (stereocilia) of hair cells in inner ear. Anterior to the left and dorsal to the top. ac anterior crista, am anterior macula, ce cerebellum, GCL ganglion cell layer, hb hindbrain, INL inner nuclear layer, IPL inner plexiform layer, lc lateral crista, ONL outer nuclear layer, pc posterior crista.pm posterior macula, RPE retinal pigment epithelium, TeO optic tectum. PHENOTYPE:
|
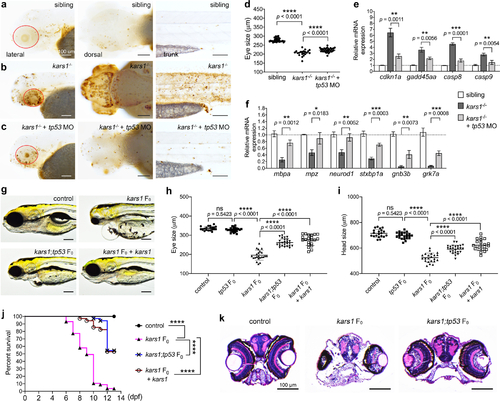
Fig. 4. Cell apoptosis was activated by kars1 loss of function through p53 pathway. (a–c) Representative images of sibling, kars1−/−, and kars1−/− + p53 MO at 3 dpf after TUNEL staining. Red circle indicates eye region. Scale bars = 100 µm. (d) The eye size measurements of sibling, kars1−/− and kars1−/− + p53 MO at 3 dpf. (e) The expression levels of p53 pathway genes were examined by reverse transcription quantitative polymerase chain reaction (RT-qPCR) after p53 MO injection. (f) Those downregulated genes in RNA-seq data were examined by RT-qPCR after p53 MO injection. For (e,f), the expression levels were normalized to 18 S housekeeping gene. Error bars = mean ± SD. Two-tailed unpaired Student’s t-test with Holm–Šídák multiple comparisons correction: ns, not significant p ≥ 0.05, *p < 0.05, **p < 0.01, and ***p < 0.001. (g) Representative images of uninjected control, kars1 F0 mutant, kars1;tp53 F0 mutant, and kars1 F0 mutant coinjected with kars1 messenger RNA (mRNA) at 5 dpf. Lateral view, anterior to the left. (h,i) Measurement of eye and head size in control, tp53 F0 mutant, kars1 F0 mutant, kars1;tp53 F0 mutant, and kars1 F0 mutant coinjected with 150 picogram (pg) and 200 pg of kars1 mRNA at 5 dpf. For (d,h,i), each symbol represents one animal. Error bars = mean ± SD. One-way analysis of variance (ANOVA) with Tukey’s multiple comparisons test: ns, not significant p ≥ 0.05 and ****p < 0.0001. (j) Kaplan–Meier survival curves. Time is shown in days. Log rank test: ****p < 0.0001. (k) Histology analysis of uninjected control, kars1 F0 mutant and kars1;tp53 F0 mutant by cross-section. EXPRESSION / LABELING:
PHENOTYPE:
|

ZFIN is incorporating published figure images and captions as part of an ongoing project. Figures from some publications have not yet been curated, or are not available for display because of copyright restrictions. EXPRESSION / LABELING:
|
|
ZFIN is incorporating published figure images and captions as part of an ongoing project. Figures from some publications have not yet been curated, or are not available for display because of copyright restrictions. EXPRESSION / LABELING:
PHENOTYPE:
|
|
ZFIN is incorporating published figure images and captions as part of an ongoing project. Figures from some publications have not yet been curated, or are not available for display because of copyright restrictions. |
|
ZFIN is incorporating published figure images and captions as part of an ongoing project. Figures from some publications have not yet been curated, or are not available for display because of copyright restrictions. EXPRESSION / LABELING:
PHENOTYPE:
|
|
ZFIN is incorporating published figure images and captions as part of an ongoing project. Figures from some publications have not yet been curated, or are not available for display because of copyright restrictions. EXPRESSION / LABELING:
PHENOTYPE:
|