
- Title
-
Examination of a palatogenic gene program in zebrafish
- Authors
- Swartz, M.E., Sheehan-Rooney, K., Dixon, M.J., and Eberhart, J.K.
- Source
- Full text @ Dev. Dyn.

Comparison of zebrafish and mouse palatogenesis with a detailed look at zebrafish palate formation. A,B: Outlines of embryos (lateral view), after CNCC condensation in the frontonasal (yellow), maxillary (turquoise), and mandibular (green) domains of zebrafish (A) and mouse (B). C,D: Drawings of cross-sections through heads of zebrafish (C) and mouse (D) after formation of the palate. Colors correspond to similar structures across both species. E,F,H: In situ hybridization of sox9a expression marking the palatal CNCC in zebrafish, ventral view with anterior to the left is shown, and mandibular crest have been removed to allow full view of the developing palate. E: At 36 hours postfertilization (hpf), sox9a expression marks the CNCC that line the maxillary (arrow) and the frontonasal (arrowhead) domains before their migration to the midline. F: Migration of frontonasal cells to the midline to begin the formation of the ethmoid plate (arrowhead) at 44 hpf and maxillary cells (arrow) begin rearrangements to form the trabeculae rods of the palate. G: By 48 hpf, most, if not all, frontonasal CNCC have migrated to the midline (arrowhead) and trabeculae rods are well formed in the palate (arrow). fn, frontonasal CNCC; mx, maxillary CNCC; md, mandibular CNCC; e, eye; ea, ear; b, brain; n, nasal opening; p, palate; o, oral opening; t, tongue; M, Meckel′s. |
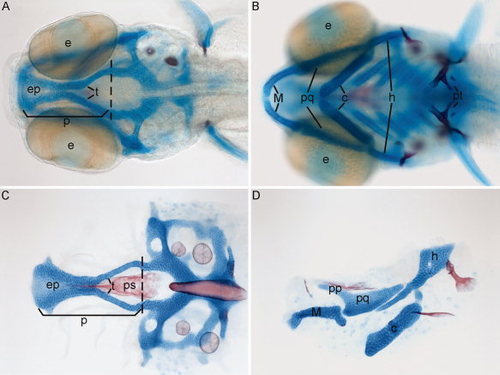
Wild-type craniofacial cartilage and bone. A–D: Alcian blue and Alizarin red-stained cartilages and bones, respectively, of 5 days postfertilization (dpf) zebrafish, anterior is to the left. A: Whole-mount dorsal view showing the neurocranium. B: Ventral view showing the pharyngeal elements. C: Dorsal flat mount view of the neurocranium. D: Lateral view of first and second arch pharyngeal elements, dorsal is up. A,C: Palate is anterior to the dashed line and comprised of the ethmoid plate and trabeculae. e, eye; ep, ethmoid plate; t, trabeculae; p, palate; M, Meckel′s cartilage; pq, palatoquadrate; c, ceratohyl; h, hyosymplectic; pt, pharyngeal teeth; pp, pterogoid process (upperjaw); ps, paresphenoid. |
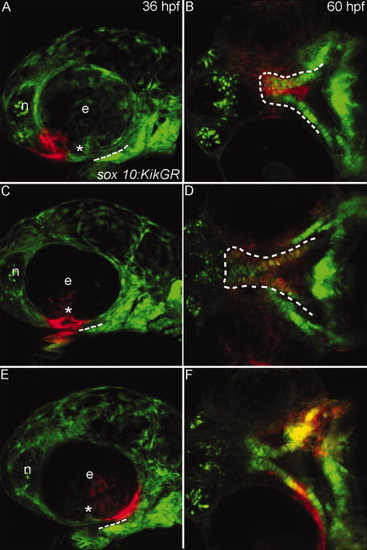
Progenitor domains for the zebrafish palate. A–F: Sox10:KikGR photoconverted cranial neural crest cells (CNCC) in red. A,C,E: Lateral images of the zebrafish head at 36 hours postfertilization (hpf) dashed lines indicate the oral ectoderm, asterisk marks location of the choroid fissure. B,D,F: Ventral view of the developing palatal skeleton at 60 hpf, the developing palate is outlined by the dashed white lines. In some cases other CNCC-derived tissues were labeled as the UV penetrated through the embryo, but here we focus on the palatal skeleton. A: CNCCs adjacent to the eye and nasal epithelium (termed frontonasal CNCC) were labeled. B: Labeled cells occupy the midline of the ethmoid plate. C: CNCCs adjacent to and anterior to the choroid fissure (anterior maxillary CNCC) were labeled. D: Photoactivated CNCC populate the lateral ethmoid and anterior portion of the trabeculae. E: CNCCs labeled posterior to the choroid fissure (posterior maxillary CNCC) F: will contribute to the posterior portion of the trabeculae. e, eye; n, nasal opening. |
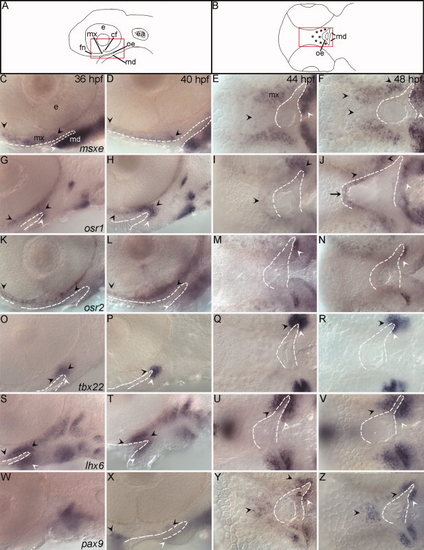
Transcription factors important in amniote palatogenesis are expressed during development of the zebrafish palate. A,B: Schematics representing lateral view of 36, 40 hours postfertilization (hpf) and ventral view at 44, 48 hpf RNA in situ hybridizations respectively, asterisks mark palate-forming cranial neural crest cells (CNCC). C,D,G,H,K,L,O,P,S,T,W,X: Lateral views at 36 and 40 hpf and E,F,I,J,M,N,Q,R,U,V,Y,Z: ventral views at 44 and 48 hpf are shown. Arrowheads indicate areas of CNCC expression domains, black for palatal precursor CNCC and white for mandibular CNCC, while arrows mark expression in oral ectoderm. In all images the oral ectoderm is outlined by white dashes to aid in its visualization. C–F: msxe is expressed in frontonasal, maxillary and mandibular cranial neural crest cells (CNCC) from 36 hpf to 48 hpf. G–J: osr1 expression is restricted to maxillary and a small portion of mandibular CNCC from 36 to 40 hpf and then also includes dorsal oral ectodermal cells at 44 to 48 hpf. K–N: osr2 is expressed in the frontonasal and maxillary CNCC at 36 and 40 hpf. At 44 and 48 hpf osr2 expression becomes restricted to a subpopulation of the mandibular CNCC expression. O–R: The expression domain of tbx22 in CNCC increases with time and is limited to the posterior maxillary and mandibular domains, wrapping around the oral ectoderm. S–V: CNCC express lhx6, wrapping around the oral ectoderm. This expression includes both the maxillary and mandibular domains and extends further than tbx22 into more anterior crest cells within each domain. W–Z: pax9a is not expressed at 36hpf in the first arch, but is expressed in the frontonasal and posterior maxillary CNCC from 40 to 48 hpf with a small area of expression in the oral ectoderm. e,eye; mx, maxillary domain; md, mandibular domain; fn, frontonasal CNCC; cf, choroid fissure; oe, oral ectoderm; ea, ear. |
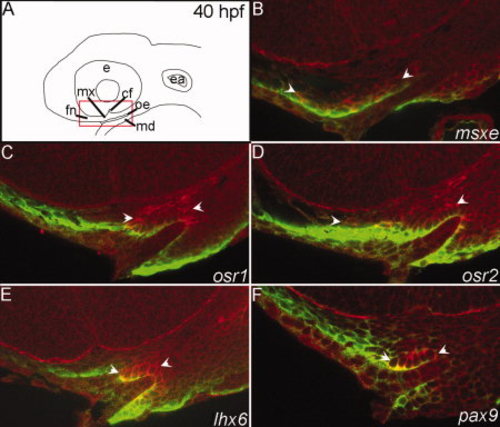
Fluorescent in situ hybridization optical sections verify the expression patterns of select transcription factors at 40 hours postfertilization (hpf). A: Schematic diagrams of a lateral view of the zebrafish head at 40 hpf, red box indicates the magnified view of the in situ sagittal sections. B–F: mRNA localization detected by fluorescence of the NBT/BCIP precipitate (red) and anti-enhanced green fluorescent protein (EGFP) immunostaining labels cranial neural crest cells (CNCC) in the fli1:EGFP transgenic background (green). Arrowheads indicate areas of CNCC expression domains. B:msxe is expressed in frontonasal and maxillary CNCC. C:osr1 is expressed in maxillary CNCC. D:osr2 is expressed in the frontonasal and maxillary CNCC. E: Maxillary CNCC express lhx6. F: The posterior maxillary CNCC express pax9. e, eye; mx, maxillary domain; md, mandibular domain; fn, frontonasal CNCC; cf, choroid fissure; oe, oral ectoderm; ea, ear. EXPRESSION / LABELING:
|
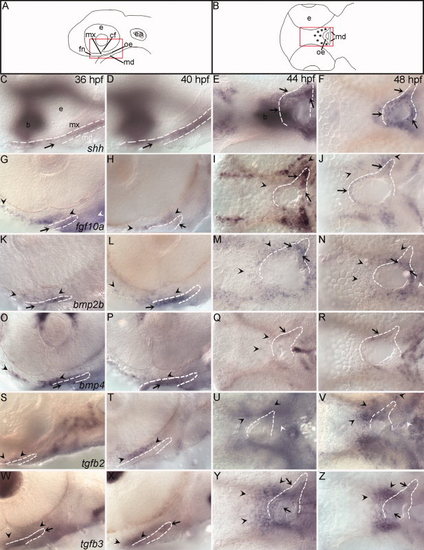
The expression of signaling molecules involved in amniote palatogenesis is conserved in zebrafish. A,B: Schematic diagrams representing lateral view of 36, 40 hours postfertilization (hpf) and ventral view at 44, 48 hpf RNA in situ hybridizations respectively. Red boxes outline location of images, asterisks mark palate-forming cranial neural crest cells (CNCC). C,D,G,H,K,L,O,P,S,T,W,X: Lateral views at 36 and 40 hpf (E,F,I,J,M,N,Q,R,U,V,Y,Z) ventral views at 44 and 48 hpf. Arrowheads indicate areas of CNCC expression black for maxillary and white for mandibular, while arrows indicate expression in oral ectoderm. In all images the oral ectoderm is outlined by white dashes to aid in its visualization, ventral views, only one side of the embryo is outlined. C–F: The oral ectoderm expresses shh at all time points examined, out of focus expression is shh expression in the brain (b). G–J: Both anterior oral ectoderm and frontonasal and maxillary CNCC express fgf10a from 36 to 40 hpf. fgf10a CNCC expression and oral ectodermal expression remains at 44 hpf. K–N: A subpopulation of anterior CNCCs and the oral ectoderm express bmp2b at 36 and 40 hpf. By 44 hpf this expression expands to include more posterior CNCCs. Likewise, over time an anterior oral ectoderm expression domain of bmp2b expands to include more posterior oral ectoderm. O–R: At 36 and 40 hpf bmp4 expression is in the oral ectoderm (arrow) and the frontonasal and maxillary CNCC, although there appears to be a gap between the maxillary and frontonasal expression domains. The oral ectodermal expression of bmp4 does not expand and CNCCs lose expression by 48 hpf. S–V: tgfb2 is initially weakly expressed in an anterior domain of maxillary CNCC at 36 and by 40 hpf the expression is stronger. W–Z: The oral ectoderm expresses tgfb3 at all time points. At 36 and 40 hpf, a small population of maxillary CNCC express tgfb3. By 44 hpf this CNCC expression has greatly expanded to include most, if not all, palatal CNCCs. e, eye; mx, maxillary domain; md, mandibular domain; fn, frontonasal CNCC; cf, choroid fissure; oe, oral ectoderm; ea, ear. |
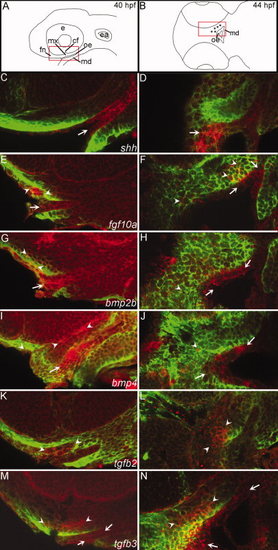
Fluorescent in situ hybridization optical sections verify the expression patterns of signaling molecules at 40 and 44 hours postfertilization (hpf). A: Schematic lateral view of the zebrafish head at 40 hpf, red box indicates the magnified view of the in situ sagittal optical sections. B: Schematic diagram of the zebrafish head in ventral view, red box indicates area of in situ horizontal optical sections. C–N: mRNA localization is detected by fluorescence of NBT/BCIP precipitate in red and anti-enhanced green fluorescent protein (EGFP) immunostaining labels cranial neural crest cells (CNCC) in the fli1:EGFP transgenic background in green. Arrowheads indicate areas of CNCC expression domains, arrows indicate expression in the oral ectoderm. C,D:shh is expressed in the oral ectoderm at both time points. E: Both anterior oral ectoderm and frontonasal and maxillary CNCC express fgf10a at 40 hpf. F:fgf10a CNCC expression and oral ectodermal expression remains at 44 hpf. G: Anterior CNCCs and oral ectoderm express bmp2b at 40 hpf. H: By 44 hpf bmp2b is expressed more broadly in the oral ectoderm and less in the CNCC. I:bmp4 expression is in the oral ectoderm and the CNCC. J: At 44 hpf only a few CNCC express bmp4 while much of the oral ectoderm maintains bmp4 expression. K,L: Anterior CNCC express tgfb2 at 40 and 44 hpf. M–N: At both 40 and 44 hpf tgfb3 is expressed in anterior CNCC and the weak expression in the oral ectoderm. |
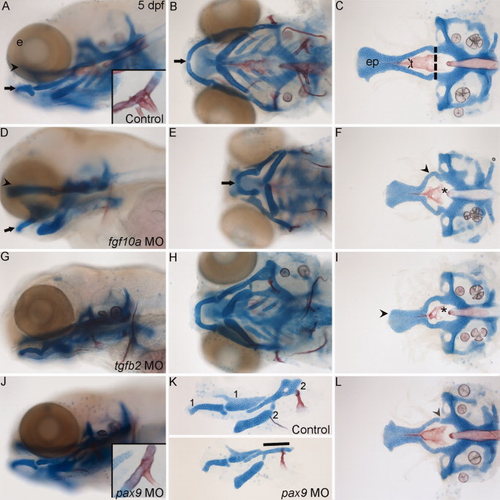
Loss of signaling molecules and transcription factors important in amniote palatogenesis causes craniofacial defects in zebrafish. A–L: Alcian blue and Alizarin red stained the cartilages and bones, respectively, of 5 days postfertilization (dpf) zebrafish. (A: Whole-mount lateral and (B) ventral views of an uninjected control craniofacial skeleton (arrowhead, palate; black arrow, Meckel′s cartilage). C: Flat mounted neurocranium. The anterior neurocranium or zebrafish palate is anterior to the dashed lines. A: Inset is a magnified view showing the three pharyngeal teeth present at this stage. D–F: fgf10a morpholino-injected fish have severely misshaped jaws and palate. D,E: Lateral and ventral views highlight the shortened ethmoid plate and jaw. F: Flatmount view of the neurocranium reveals the shortened ethmoid plate and misshaped trabeculae (arrowhead) and parasphenoid bone (asterisk). G–I: tgfb2 knockdown also causes shortening and misshaping of the jaw, ethmoid plate, trabeculae and parasphenoid. I: Misshaped shortened palate marked by arrowhead, misshaped parsasphenoid marked by asterisk. J–L: pax9a morpholino injection causes defects of the jaw, hyomandibular cartilage, palatal skeleton and teeth. J: Inset, shows the reduction in the number of teeth. K: Lateral view of flat mounted first and second arch-derived pharyngeal skeletal elements, control, (top half of panel) and pax9a morpholino-injected embryos (bottom half of panel). The second arch hyomandibular cartilage is reduced to a rod-like structure in this example (line). L: The palatal skeleton fails to fuse to the posterior neurocranium, arrowhead. Anterior is to the left in all panels. e, eye; ep, ethmoid plate; t, trabeculae. PHENOTYPE:
|

Neural crest cells require the reception of Bmp signaling for palatogenesis in zebrafish. A,B,C,F,I: Whole-mount Alcian Blue/Alizarin Redstained 5 days postfertilization (dpf) zebrafish. D,E,G,H: Genetic mosaics in which Alexa-568 dextran labels donor cells (red). A,B: Ventral views (C,F,I) dorsal views (D,G) lateral views (E,H) ventral views focused on the palatal skeleton. A: Wild-type and (B,C) smad5 mutant zebrafish larvae. B: In the pharyngeal skeleton, Meckel′s cartilages are reduced and fail to meet at the midline symphysis, asterisk. Additionally, the ceratohyal cartilage is fused to the first ceratobranchial cartilage black arrowhead. C: Only small remnants of the trabeculae remain in the palatal skeleton of smad5 mutants. D–F: Transplantation of wild-type neural crest cells into smad5 mutants partially rescues the palatal skeleton. D: At 30 hours postfertilization (hpf), wild-type neural crest cells (yellow) contribute readily to the first pharyngeal arch of smad5 mutant embryos. (E,F: By 5 dpf these wild-type cells have populated the palatal skeleton (white arrowheads in E) and substantially rescued the trabeculae and partially rescued the ethmoid plate (white arrowhead in F). G–I: In reciprocal transplants, (G) smad5 mutant neural crest cells readily condense on the oral ectoderm in the maxillary and frontonasal domains. H: At 5 dpf, many smad5 mutant cells remain in the region of the developing palate; however few of these cells contribute to the palatal skeleton and (I) the trabeculae and ethmoid plate are both disrupted on the side of the transplant (white arrowheads). M, Meckel′s cartilage; ch, ceratohyal; cb1, first ceratobranchial; t, trabeculae. PHENOTYPE:
|