
- Title
-
The developmental sequence of gene expression within the rod photoreceptor lineage in embryonic zebrafish
- Authors
- Nelson, S.M., Frey, R.A., Wardwell, S.L., and Stenkamp, D.L.
- Source
- Full text @ Dev. Dyn.
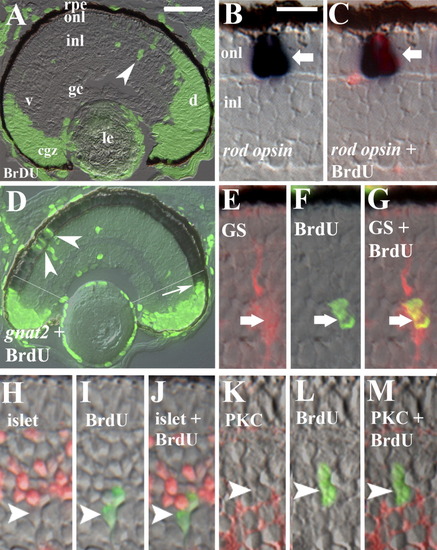
BrdU incorporation within the rod lineage in embryonic zebrafish. Embryos were injected with BrdU at 60 hpf and fixed at 75 hpf. A: Retinal cryosection showing distribution of BrdU in the circumferential germinal zone (cgz) and in radial arrays of cells (arrowhead) spanning the inner (inl) and outer nuclear layers (onl) in central retina; le, lens; rpe, retinal pigmented epithelium; gc, ganglion cell layer; v, ventral; d, dorsal. B,C: BrdU and rod opsin; Nomarski optics (B) merged with epifluorescent image (C); arrow indicates colabeled cell. D: BrdU and gnat2 colabeling showing BrdU-labeled cones in retinal periphery (arrow) and cells in the central onl labeled only for BrdU (arrowheads). Regions to the periphery of the thin white lines (located approximately 6 onl cell diameters from the unlaminated cgz) were excluded from subsequent analyses related to the rod lineage. E-G: BrdU and anti-GS; arrow indicates colabeled cell. H-J: BrdU and islet1; no colabeling was observed (arrowhead indicates singly-labeled cell). K-M: Section doubly-labeled for BrdU and PKC; no colabeling was observed (arrowhead indicates singly-labeled cell). Scale bar in A (applies to A, D) = 40 μm, in B (applies to B,C,E-M) = 10 μm. EXPRESSION / LABELING:
|
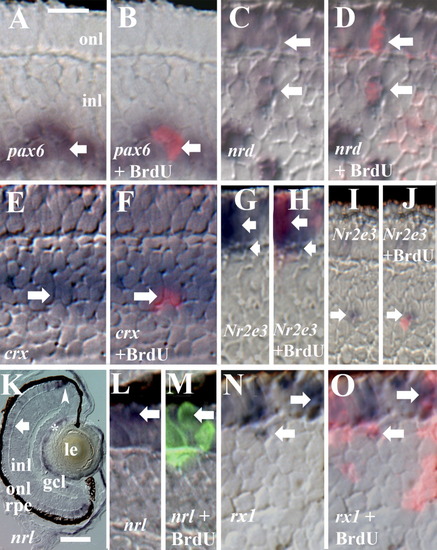
Gene expression in cells of the BrdU+ rod lineage. All embryos were injected with BrdU at 60 hpf and fixed at 75 or 80 hpf. A,B: BrdU and pax6; Nomarski optics (A) merged with epifluorescence image (B); arrow indicates colabeled cell. C,D: BrdU and NeuroD; Nomarski optics (C), merged with epifluorescence image (D); two colabeled cells are indicated by arrows. E,F: BrdU and crx; Nomarski optics (E), merged with epifluorescence image (F); arrow indicates colabeled cell. G-J: BrdU and Nr2e3; Nomarski optics (G,I), merged with epifluorescence images (H,J); colabeled cells are indicated by arrows. K: Retinal expression pattern of nrl; both rod (arrow) and cone progenitors (arrowhead) are labeled, as well as cells of the lens (*). L,M: BrdU and nrl; Nomarski optics (L), merged with epifluorescence image (M); arrow indicates colabeled cell. N,O: BrdU and rx1; Nomarski optics (N), merged with epifluorescence image (O); colabeled cells are indicated by arrows. rpe, retinal pigmented epithelium; onl, outer nuclear layer; inl, inner nuclear layer; gcl, ganglion cell layer; le, lens. Scale bar in A (applies to all except K) = 10 μm, in K = 40 μm. EXPRESSION / LABELING:
|
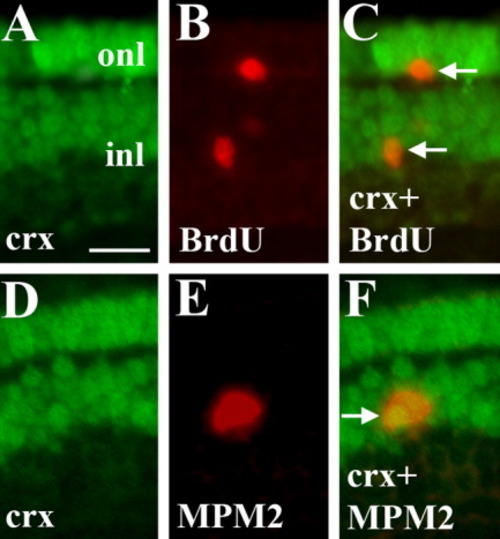
Crx protein expression in mitotic cells of the BrdU+ rod lineage. A-C: Embryo was injected with BrdU at 60 hpf and fixed at 75 hpf, and processed for indirect immunofluorescence with anti-crx (A) and anti-BrdU (B). C shows merged image and colabeled cells (arrows). D-F: Embryo fixed at 72 hpf and processed for indirect immunofluorescence with anti-crx (D) and MPM-2 (mitotic cells; E). F shows merged image and colabeled cells (arrow). Scale bar in A (applies to all) = 10 μm. EXPRESSION / LABELING:
|
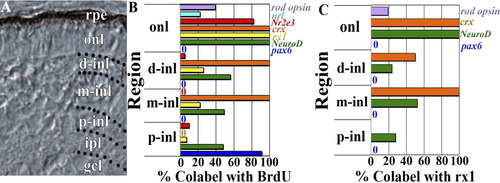
Colabeling quantification by onl and inl compartments. A: Retinal cryosection from 72-hpf embryo showing subdivision of the inner nuclear layer (inl) into proximal (p-inl), medial (m-inl), and distal (d-inl) compartments; further explanation is provided in the Results section. B: BrdU colabeling with rod opsin, nrl, Nr2e3, crx, rx1, NeuroD, and pax6, by retinal lamina and defined inl compartments. C: Rx1 colabeling with rod opsin, crx, NeuroD, and pax6, by retinal lamina and defined compartments of the inl. rpe, retinal pigmented epithelium; onl, outer nuclear layer; gcl, ganglion cell layer. |
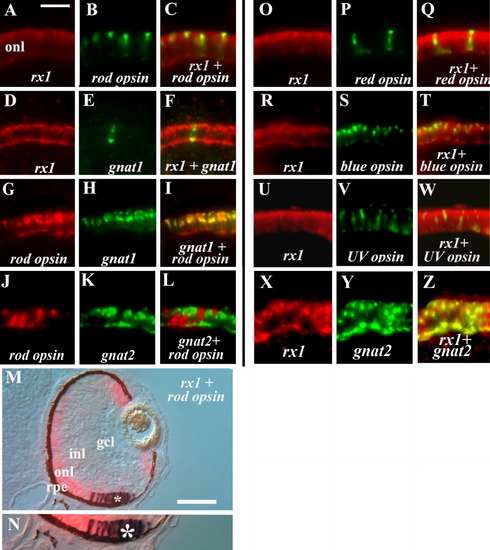
Rx1 expression in all photoreceptor subtypes. All panels show retinal cryosections of 72-hpf embryos. A-C: rx1 (A) and rod opsin (B) colabeling (C). D-F: rx1 (D) and gnat1 (E) colabeling (F). G-I: rod opsin (G) and gnat1 (H) colabeling (I; positive control). J-L: rod opsin (J) and gnat2 (K) show no colabeling (L; negative control). M,N: rx1 and rod opsin colabeling using an alternative set of reaction products; N is an enlargement of region in M indicated by *, showing colabeled cells. O-Q: rx1 (O) and red opsin (P) colabeling (Q). R-T: rx1 (R) and blue opsin (S) colabeling (T). U-W: rx1 (U) and uv opsin (V) colabeling (W). X-Z: rx1 (X) and gnat2 (Y) colabeling (Z). onl, outer nuclear layer; inl, inner nuclear layer; gcl, ganglion cell layer; rpe, retinal pigmented epithelium. Scale bar in A (applies to A-L, O-W) = 20 μm; in M = 50 μm. EXPRESSION / LABELING:
|

Rx1 coexpression with rod lineage markers. A-C: rx1 (A) and pax6 (B) double in situ; merged image (C) showing no colabeled cells (arrowhead). D: rx1 (purple) and pax6 (pink) using alternative reaction products; arrowhead = rx1+ cell only. E-G: rx1 (E) and NeuroD (F); merged image (G) showing colabeling in the inl (arrow) and throughout the onl; arrowhead = rx1+ cell only. H: rx1 (purple) and NeuroD (pink) using alternative reaction products; doubly-labeled cell (arrow) and rx1+ cell only (arrowhead). I-K: rx1 (I) and crx (J); merged image (K) showing a colabeled cell in the inl (arrow) and throughout the onl; arrowhead = rx1+ cell only. L: rx1 (purple) and crx (pink) using alternative reaction products, showing a doubly-labeled cell (arrow) and an rx1+ cell only (arrowhead). M-O: NeuroD (M) and crx (N); merged image (O) showing a colabeled cell in the inl (arrow) and throughout the onl; arrowhead = NeuroD+ cell only. P: NeuroD (pink) and crx (purple) using alternative reaction products, showing doubly-labeled cell (arrow). onl, outer nuclear layer; inl, inner nuclear layer; scale bar in A (applies to A-C,E-G,I-K,M-O) = 20 μm; in D (applies to E,H,L,P) = 20 μm. *, areas enlarged in insets. EXPRESSION / LABELING:
|
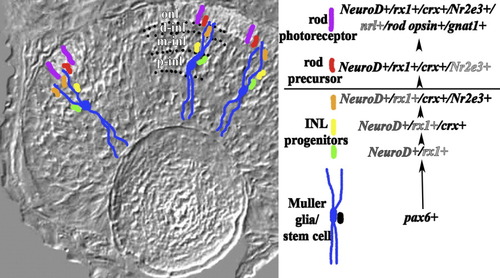
Gene expression in the embryonic rod lineage of zebrafish. Gene expression summary at right shows the genetic hierarchy of the rod lineage; darkness of font reflects the extent to which the transcription factor is expressed within the identified cells of the lineage. Pax6-positive Müller glia/stem cells are shown in blue with their cell bodies in the inner region of the inl. The summary at right illustrates an alternative scenario in which pax6+ stem cells (in black) generate embryonic Müller glia as well as cells of the rod lineage. As rod progenitors proliferate and migrate toward the onl, some become NeuroD-positive and rx1-positive (green cells), but none remain pax6-positive. All of these progenitors later express crx (yellow). Prior to entering the onl, some rod progenitors express NeuroD, rx1, and Nr2e3, while all continue to express crx (orange). All rod precursors of the onl (red) are NeuroD, rx1, crx, and Nr2e3-positive but do not express nrl, rod opsin, or gnat 1. Postmitotic rod photoreceptors (purple) express NeuroD, rx1, crx, Nr2e3, nrl, rod opsin, and gnat1. onl, outer nuclear layer; p-inl, m-inl, d-inl are proximal, middle, and distal compartments of the inl, respectively, and are delineated by dotted lines. |

Unillustrated author statements EXPRESSION / LABELING:
|