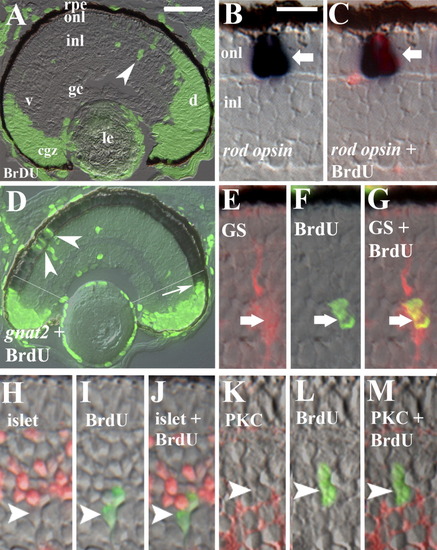
BrdU incorporation within the rod lineage in embryonic zebrafish. Embryos were injected with BrdU at 60 hpf and fixed at 75 hpf. A: Retinal cryosection showing distribution of BrdU in the circumferential germinal zone (cgz) and in radial arrays of cells (arrowhead) spanning the inner (inl) and outer nuclear layers (onl) in central retina; le, lens; rpe, retinal pigmented epithelium; gc, ganglion cell layer; v, ventral; d, dorsal. B,C: BrdU and rod opsin; Nomarski optics (B) merged with epifluorescent image (C); arrow indicates colabeled cell. D: BrdU and gnat2 colabeling showing BrdU-labeled cones in retinal periphery (arrow) and cells in the central onl labeled only for BrdU (arrowheads). Regions to the periphery of the thin white lines (located approximately 6 onl cell diameters from the unlaminated cgz) were excluded from subsequent analyses related to the rod lineage. E-G: BrdU and anti-GS; arrow indicates colabeled cell. H-J: BrdU and islet1; no colabeling was observed (arrowhead indicates singly-labeled cell). K-M: Section doubly-labeled for BrdU and PKC; no colabeling was observed (arrowhead indicates singly-labeled cell). Scale bar in A (applies to A, D) = 40 μm, in B (applies to B,C,E-M) = 10 μm.
|
