
- Title
-
Mecp2 regulates neural cell differentiation by suppressing the Id1-Her2/Hes5 axis in zebrafish
- Authors
- Gao, H., Bu, Y., Wu, Q., Wang, X., Chang, N., Lei, L., Chen, S., Liu, D., Zhu, X., Hu, K., Xiong, J.W.
- Source
- Full text @ J. Cell Sci.
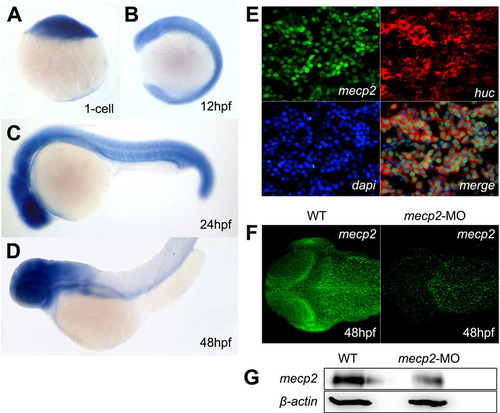
mecp2 is enriched in the embryonic and adult brain in zebrafish. (A–D) RNA in situ hybridization with mecp2 probe in one-cell (A), 12hpf (B), 24hpf (C) and 48hpf (D) wild-type (WT) embryos. Note that mecp2 is broadly expressed in one-cell to 24hpf embryos and is enriched in the developing brain of 48hpf embryos (C,D). (E) Immunostaining of frozen sections of the adult zebrafish brain with anti-Mecp2 and anti-Huc antibody. Mecp2 protein was localized in the nuclei of neurons in which Huc protein was highly expressed. (F,G) Immunostaining (with embryos) and western blot (with protein extracts) in the developing zebrafish brain at 48hpf with anti-Mecp2 antibody. Mecp2 protein was reduced in mecp2 morphants compared with wild-type embryos. β-actin was used as a loading control. Lateral views (B–D) are shown with anterior to the left; a dorsal view is shown in F. |
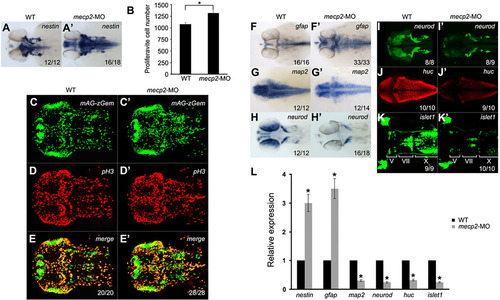
Knockdown of mecp2 increases neural precursors and astrogenesis while suppressing neurogenesis. (A,A2) RNA in situ hybridization performed with nestin probe in controls (wild-type, WT) (A) and mecp2 morphants (A′) at 48hpf. Note the upregulated nestin expression in the developing brain of mecp2 morphants. (B–E′) mecp2-MOs were injected into Tg(ef1α:mAG-zGem) transgenic embryos, in which GFP-positive cells are in the S, G2 and M phase of the cell cycle. Immunostaining was performed using an anti-pH3 antibody (red). The numbers of green fluorescence-positive cells and pH3-positive mitotic cells were increased in mecp2 morphants at 48hpf (C′,D′,E′) compared with the wild-type (C,D,E). Numbers of proliferative cells labeled by Tg(ef1α:mAG-zGem) were counted using Imaris software (B). Dorsal views are shown with anterior to the left (A,A&prime& C–E′). (F–H′) RNA in situ hybridization revealed that gfap expression was increased in the developing brain of mecp2 morphants (F′), compared with the wild-type (F) at 48hpf. However, map2 and neurod expression was reduced in mecp2 morphants (G′,H′) compared with controls (G,H) at 48hpf. (I,I′) mecp2-MOs were injected into Tg(neurod:EGFP) transgenic embryos. Note that neurod was downregulated in mecp2 morphants (I′), compared with controls (I) at 48hpf. (J,J′) Whole-mount immunostaining with antibody against Huc. Huc was downregulated in mecp2 morphants (J′), compared with controls (J) at 48hpf. (K,K′) mecp2-MOs were injected into Tg(islet1:EGFP) transgenic embryos, in which GFP-positive cells are motor neurons. The number of GFP-positive cells was reduced in mecp2 morphants (K′), compared with the wild-type (K) at 48hpf. Dorsal views are shown with anterior to the left (F–K′). (L) Quantitative real-time PCR analysis of related genes in wild-type embryos and mecp2 morphants, normalized to gapdh. Measurements are the mean±s.d. from three independent experiments. *P<0.05. In A,A′, and C–K′, numbers in the bottom right corner represent the number of embryos showing the indicated phenotype/total embryos examined. EXPRESSION / LABELING:
PHENOTYPE:
|
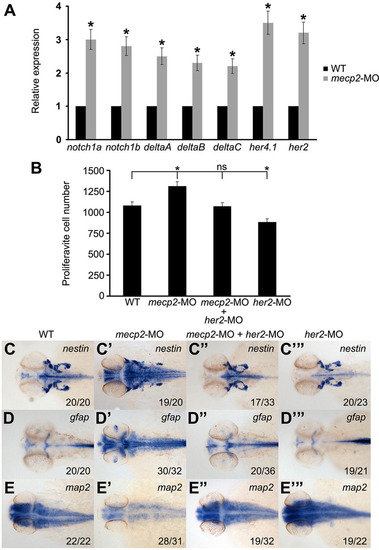
mecp2 mediates her2 expression to control neural cell differentiation. (A) Quantitative real-time PCR analysis of related gene expression in wild-type (WT) embryos and mecp2 morphants, normalized to gapdh. Measurements are the mean±s.d. from three independent experiments. *P<0.05. (B) Number of proliferative cells labeled with Tg(ef1α:mAG-zGem) returned to the normal level in mecp2 morphants co-injected with her2-MO, compared with wild-type embryos at 48hpf. Accordingly, knockdown of her2 decreased neural cell proliferation. Statistics of all groups were calculated by comparison with the wild-type group. Error bars indicate the s.d. *P<0.05; ns, not significant. (C–E′′′) The neural progenitor marker nestin and astrocyte marker gfap increased whereas the neuronal marker map2 decreased in mecp2 morphants (C′,D′,E′) that were partially rescued by co-injection with her2-MO (C′′,D′′,E′′), compared with controls (C,D,E). Accordingly, nestin and gfap were downregulated, whereas map2 was upregulated in her2 morphants (C′′′,D′′′,E′′′), compared with the wild-type (C,D,E) at 48hpf. Dorsal views with anterior to the left; numbers in the bottom right corner represent the number of embryos showing the indicated phenotype/total embryos examined. |
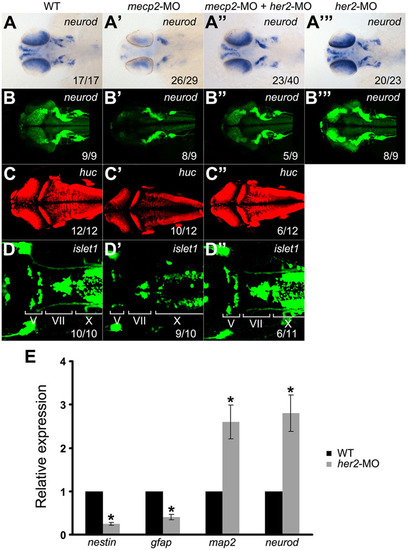
mecp2 negatively regulates her2 expression to control neural cell differentiation. (A–D′′) neurod, huc and islet1 decreased in mecp2 morphants (A′–D′), and this was partially rescued by co-injection of her2-MO (A′′–D′′), compared with controls (A–D). The expression of neurod increased in her2 morphants (A′′′,B′′′), compared with the wild-type (WT) (A,B). Dorsal views, with anterior to the left (A–D′). The numbers in the bottom right corner represent the number of embryos showing the indicated phenotype/total embryos examined. (E) Quantitative real-time PCR analysis of related gene expression in wild-type embryos and her2 morphants, normalized to gapdh. The data represent the mean±s.d. of three independent experiments. *P<0.05. |
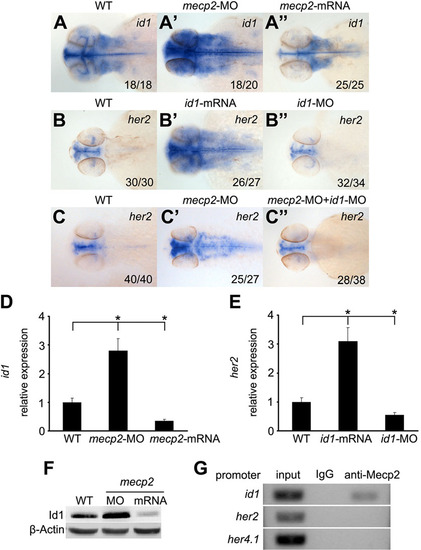
mecp2 depletion directly increases id1 expression that leads to ectopic her2 expression. (A,A′′) RNA in situ hybridization revealed that id1 increased in the developing brain of mecp2 morphants (A′), but decreased in embryos injected with mecp2 mRNA (A′′) compared with wild-type (WT) embryos (A) at 48hpf. (B,B′′) her2 increased in embryos injected with id1 mRNA (B′), but but decreased in id1 morphants (B′′) compared with controls (B) at 48hpf. (C,C′′) her2 increased in mecp2 morphants (C′) and this was rescued to the normal level by co-injecting id1-MO (C′′) compared with wild-type embryos (C). Dorsal views with anterior to the left; numbers in the bottom right corner represent the number of embryos showing the indicated phenotype/total embryos examined. (D,E) Quantitative real-time PCR analysis of id1 expression in wild-type embryos, mecp2 morphants, and embryos injected with mecp2 mRNA, normalized to gapdh (D). her2 expression was also analyzed in wild-type embryos, embryos injected with id1 mRNA and id1 morphants (E). The data represent the mean±s.d. of three independent experiments. Statistics for all groups were calculated by comparison with the wild-type (WT) group. *P<0.05. (F) Western blot revealed that Id1 protein was upregulated in mecp2 morphants, and downregulated in embryos injected with mecp2 mRNA. (G) ChIP assays were performed using an antibody against Mecp2 or IgG control. Semi-quantitative PCR was used to evaluate the promoter occupancy of id1, her2, and her4.1 by Mecp2 protein. Note direct binding of MeCP2 to the id1, but not her2 and her4.1, promoters. One of three independent experiments is shown. EXPRESSION / LABELING:
|

mecp2 regulates neural cell differentiation by down-regulating id1 expression. (A) The number of proliferative cells labeled by Tg(ef1α:mAG-zGem) increased in mecp2 morphants, and this was rescued either by co-injection of id1-MO or mecp2 mRNA at 48hpf. Proliferative cell number increased in embryos injected with id1 mRNA to a level similar to that in mecp2 morphants. Moreover, embryos injected with id1-MO or mecp2 mRNA had fewer proliferative cells than wild-type controls at 48hpf. Note that mecp2 normally suppresses id1 to regulate neural cell proliferation. Error bars indicate the s.d. Statistics of all the groups were calculated by comparison with the wild-type (WT) group. *P<0.05; ns, not significant. (B–D′′) In Tg(neurod:EGFP) transgenic embryos, neurod decreased in mecp2 morphants (B′) and this was rescued by co-injection with id1-MO at 48hpf (B′′), compared with controls (B). Immunostaining revealed that Huc was reduced in mecp2 morphants (C′) and this was rescued by co-injection with id1-MO (C′′), compared with controls (C). In Tg(islet1:EGFP) transgenic embryos, the motor neurons were eliminated in mecp2 morphants (D2), and this was rescued by co-injection with id1-MO (D′′), compared with wild-type controls (D). Dorsal views with anterior to the left (B-D′′); numbers in the bottom right corner represent the number of embryos showing the indicated phenotype/total embryos examined. (E) Summary cartoon of the control of neural cell differentiation by Mecp2 in zebrafish. MeCP2 negatively fine-tunes the expression levels of id1, which leads to activation of her2, which normally promotes the formation of astrocytes while inhibiting the derivation of neurons from neural precursors. |

mecp2 regulates neural cell differentiation by down-regulating id1 expression. (A) The number of proliferative cells labeled by Tg(ef1α:mAG-zGem) increased in mecp2 morphants, and this was rescued either by co-injection of id1-MO or mecp2 mRNA at 48hpf. Proliferative cell number increased in embryos injected with id1 mRNA to a level similar to that in mecp2 morphants. Moreover, embryos injected with id1-MO or mecp2 mRNA had fewer proliferative cells than wild-type controls at 48hpf. Note that mecp2 normally suppresses id1 to regulate neural cell proliferation. Error bars indicate the s.d. Statistics of all the groups were calculated by comparison with the wild-type (WT) group. *P<0.05; ns, not significant. (B–D′′) In Tg(neurod:EGFP) transgenic embryos, neurod decreased in mecp2 morphants (B′) and this was rescued by co-injection with id1-MO at 48hpf (B′′), compared with controls (B). Immunostaining revealed that Huc was reduced in mecp2 morphants (C′) and this was rescued by co-injection with id1-MO (C′′), compared with controls (C). In Tg(islet1:EGFP) transgenic embryos, the motor neurons were eliminated in mecp2 morphants (D′), and this was rescued by co-injection with id1-MO (D′′), compared with wild-type controls (D). Dorsal views with anterior to the left (B-D′′); numbers in the bottom right corner represent the number of embryos showing the indicated phenotype/total embryos examined. (E) Summary cartoon of the control of neural cell differentiation by Mecp2 in zebrafish. MeCP2 negatively fine-tunes the expression levels of id1, which leads to activation of her2, which normally promotes the formation of astrocytes while inhibiting the derivation of neurons from neural precursors. |
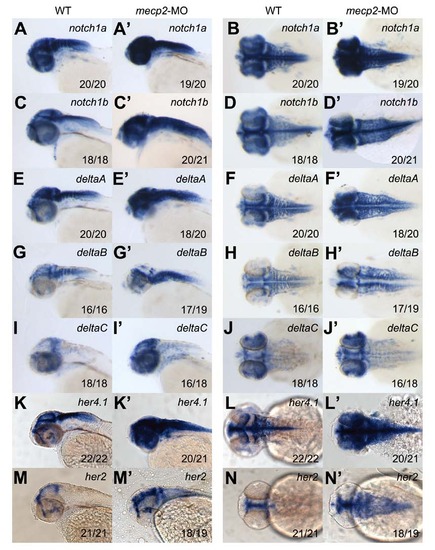
Knockdown of mecp2 enhances Notch signaling activity in the developing brain. RNA in situ hybridization with notch1a, notch1b, deltaA, deltaB, deltaC, her4.1, and her2 probes in controls (A-J) and mecp2 morphants (A′-J′) at 48 hpf. Note up-regulated expression of these Notch signaling genes in the developing brain of mecp2 morphants. Lateral views (A-A′; C-C′; E-E′; G-G′; I-I′; K-K′; M-M′) and dorsal views (B-B′; D-D′; F-F′; H-H′; J-J′; L-L′; N-N′) with the anterior to the left. The numbers in the bottom right corner represent phenotypic embryos/total embryos. |

(A-C) her2-MO inhibited EGFP expression driven by the her2 5′-UTR. (A) her2 5′UTR sequence used for driving EGFP expression, where the start code ATG of her2 is labeled as “red”, and the her2-MO sequences are underlined. (B, C) the her2 5′UTR-EGFP reporter expression was detected in control embryos (B), but not in her2-MO morphants (C). (D-F) Id1-MO inhibited EGFP expression driven by the id1 5′-UTR. (D) id1 5′UTR sequence used for driving EGFP expression, where the start code ATG of her2 is labeled as “red”, and the her2-MO sequences are underlined. (E, F) the id1 5′UTR-EGFP reporter expression was detected in control embryos (E), but not in id1-MO morphants (F). (G-M) Knockdown of mecp2 increases neural precursors and astrocytes while suppressing neuronal development but either her2 or id1 knockdown has the opposite effects. RNA in situ hybridization with nestin, gfap, map2, and neurod probes in wild-type (WT) embryos (G-G′′′), embryos injected with mecp2-mis MO (H-H′′′), mecp2 morphants (I-I′′′), embryos injected with her2-mis MO (J-J′′′), her2 morphants (K-K′′′), embryos injected with id1-mis MO (L-L′′′), and id1 morphants (M-M′′′) at 48 hpf. Note that the expression of nestin and gfap were up-regulated while map2 and neurod were down-regulated in mecp2 morphants; and the expression of nestin and gfap were down-regulated while map2 and neurod were up-regulated in both her2 morphants and id1 morphants. Dorsal views with anterior to the left. The numbers in the bottom-right corner represent phenotypic embryos/total embryos. |

(A-I) her2 is partially dependent on Notch signaling and id2a, id3 and id4, unlike id1, are decreased in mecp2 morphants. (A-B′) her2 expression was slightly up-regulated in embryos injected with NICD-mRNA (75 pg). (C) Quantitative real-time PCR analysis of her2 expression in wild-type embryos at 24 hpf and 48 hpf, normalized to gapdh. Measurements are the means from 3 independent experiments ± SD. *P <0.05. (D-D′) her2 was slightly down-regulated in mecp2 morphants treated with DAPT (100 µM). (E) Quantitative real-time PCR analysis of her2 expression in mecp2 morphants with and without DAPT, normalized to gapdh. The data represent the means of three independent experiments ± SD. *P <0.05. (F-H′) RNA in situ hybridization with id2a, id3, and id4 probes in controls (F, G, H ) and mecp2 morphants (F′, G′, H′) at 48 hpf. Note that these genes decreased in the developing brain of mecp2 morphants. Dorsal views are shown with anterior to the left (A-B′, D-D′, F-H′). The numbers in the bottom right corner represent phenotypic embryos/total embryos. (I) Quantitative real-time PCR analysis of id2a, id3, and id4 in wild-type and mecp2 morphant embryos at 48 hpf, normalized to gapdh. Measurements are the means from 3 independent experiments ± SD. *P <0.05. (J-M) Both id1-MO and mecp2-mRNA rescue the phenotype in mecp2 morphants. RNA in situ hybridization with nestin, gfap, map2 and neurod probes in controls (J-M), mecp2 morphants (J′-M′), mecp2 morphants co-injected with id1-MO (J′′-M′′) and mecp2 morphants co-injected with mecp2-mRNA (J′′′-M′′′) at 48 hpf. Note that expression of these genes in the developing brain in mecp2 morphants was rescued by co-injection of either id1-MO or mecp2-mRNA. Dorsal views are shown with anterior to the left. The numbers in the bottom right corner represent phenotypic embryos/total embryos. |
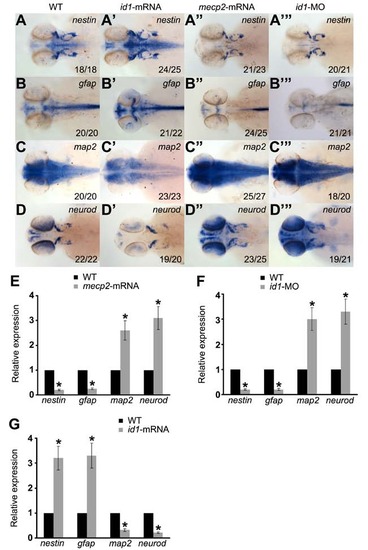
Overexpression of id1-mRNA mimics the phenotype in mecp2 morphants while id1-MO mimics that in embryos over-expressing mecp2 mRNA. RNA in situ hybridization with nestin, gfap, map2, and neurod probes in controls (A-D), embryos injected with id1-mRNA (A′-D′), embryos injected with mecp2-mRNA (A′′-D′′), and id1 morphants (A′′′-D′′′) at 48 hpf. The expression of these genes in the developing brain of embryos injected with id1-mRNA was similar to those in mecp2 morphants. The expression of nestin and gfap were down-regulated, while map2 and neurod were up-regulated in either embryos injected with mecp2-mRNA or id1 morphants. Dorsal views with anterior to the left. The numbers in the bottom right corner represent phenotypic embryos/total embryos. (E-G) Quantitative real-time PCR analysis of nestin, gfap, map2, and neurod gene expression in wild-type embryos along with embryos injected with mecp2-mRNA (E), id1 morphants (F), and embryos injected with id1-mRNA (G), normalized to gapdh. Measurements are the means from 3 independent experiments ± SD. *P <0.05. |