
Fig. 2
|
Fig. 2
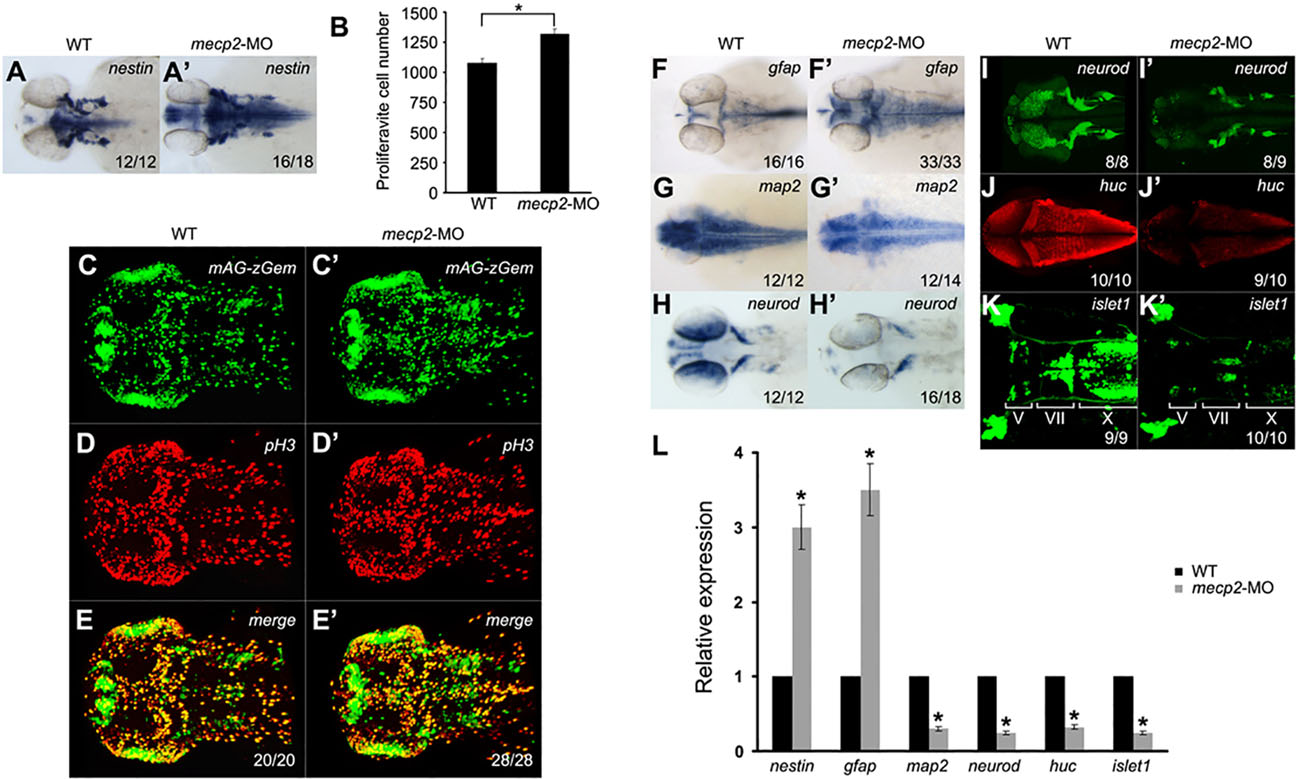
Knockdown of mecp2 increases neural precursors and astrogenesis while suppressing neurogenesis. (A,A2) RNA in situ hybridization performed with nestin probe in controls (wild-type, WT) (A) and mecp2 morphants (A′) at 48hpf. Note the upregulated nestin expression in the developing brain of mecp2 morphants. (B–E′) mecp2-MOs were injected into Tg(ef1α:mAG-zGem) transgenic embryos, in which GFP-positive cells are in the S, G2 and M phase of the cell cycle. Immunostaining was performed using an anti-pH3 antibody (red). The numbers of green fluorescence-positive cells and pH3-positive mitotic cells were increased in mecp2 morphants at 48hpf (C′,D′,E′) compared with the wild-type (C,D,E). Numbers of proliferative cells labeled by Tg(ef1α:mAG-zGem) were counted using Imaris software (B). Dorsal views are shown with anterior to the left (A,A&prime& C–E′). (F–H′) RNA in situ hybridization revealed that gfap expression was increased in the developing brain of mecp2 morphants (F′), compared with the wild-type (F) at 48hpf. However, map2 and neurod expression was reduced in mecp2 morphants (G′,H′) compared with controls (G,H) at 48hpf. (I,I′) mecp2-MOs were injected into Tg(neurod:EGFP) transgenic embryos. Note that neurod was downregulated in mecp2 morphants (I′), compared with controls (I) at 48hpf. (J,J′) Whole-mount immunostaining with antibody against Huc. Huc was downregulated in mecp2 morphants (J′), compared with controls (J) at 48hpf. (K,K′) mecp2-MOs were injected into Tg(islet1:EGFP) transgenic embryos, in which GFP-positive cells are motor neurons. The number of GFP-positive cells was reduced in mecp2 morphants (K′), compared with the wild-type (K) at 48hpf. Dorsal views are shown with anterior to the left (F–K′). (L) Quantitative real-time PCR analysis of related genes in wild-type embryos and mecp2 morphants, normalized to gapdh. Measurements are the mean±s.d. from three independent experiments. *P<0.05. In A,A′, and C–K′, numbers in the bottom right corner represent the number of embryos showing the indicated phenotype/total embryos examined.