
- Title
-
Transcriptomic Profiling of Zebrafish Mutant for cdkl5 Reveals Dysregulated Gene Expression Associated with Neuronal, Muscle, Visual and Skeletal Development
- Authors
- Varela, T., Varela, D., Conceição, N., Cancela, M.L.
- Source
- Full text @ Int. J. Mol. Sci.
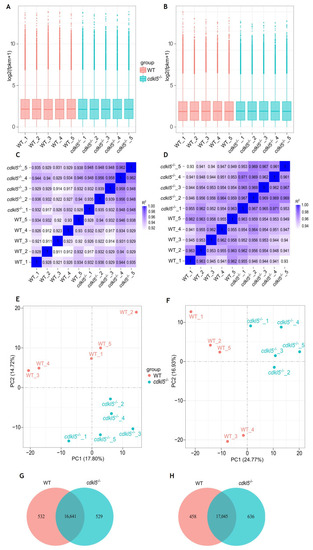
Comparison of gene expression levels between |
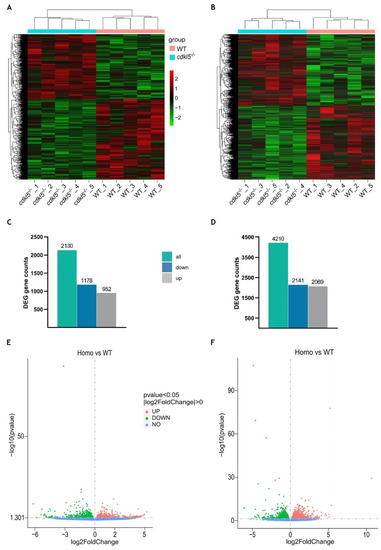
Differential gene expression analysis between |
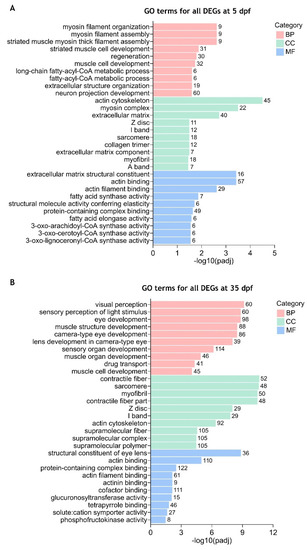
Enriched gene ontology (GO) terms for all differentially expressed genes between |

Gene ontology (GO) terms enrichment analysis for the separated downregulated and upregulated DEGs between |
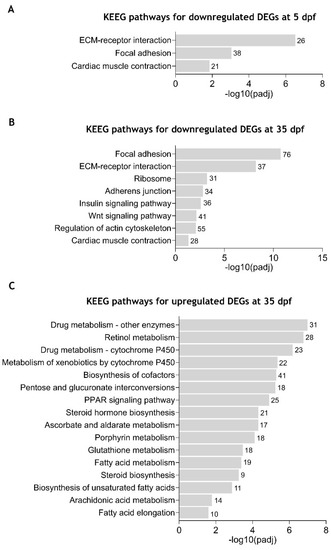
Enriched Kyoto Encyclopedia of Genes and Genomes (KEGG) pathways in zebrafish |
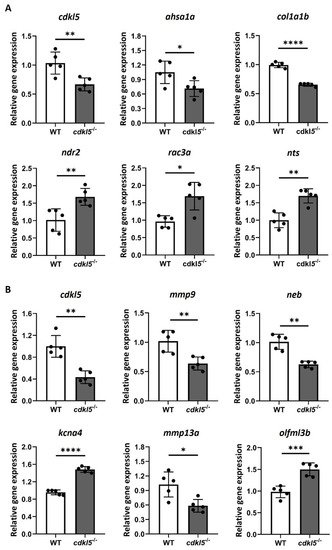
RT-qPCR analysis of a randomly selected set of DEG between EXPRESSION / LABELING:
PHENOTYPE:
|
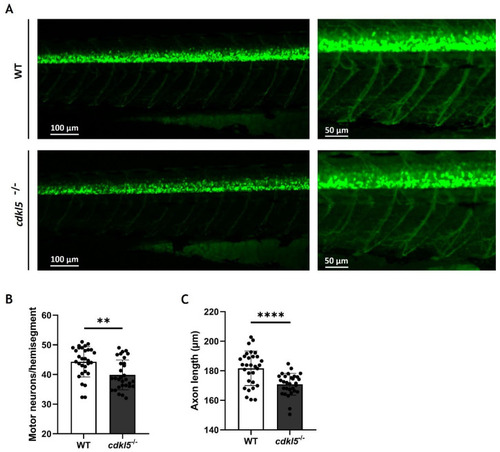
Motor neuron alterations in PHENOTYPE:
|

ZFIN is incorporating published figure images and captions as part of an ongoing project. Figures from some publications have not yet been curated, or are not available for display because of copyright restrictions. EXPRESSION / LABELING:
PHENOTYPE:
|