
FIGURE
Figure 6
- ID
- ZDB-FIG-250715-111
- Publication
- Varela et al., 2025 - Transcriptomic Profiling of Zebrafish Mutant for cdkl5 Reveals Dysregulated Gene Expression Associated with Neuronal, Muscle, Visual and Skeletal Development
- Other Figures
- All Figure Page
- Back to All Figure Page
Figure 6
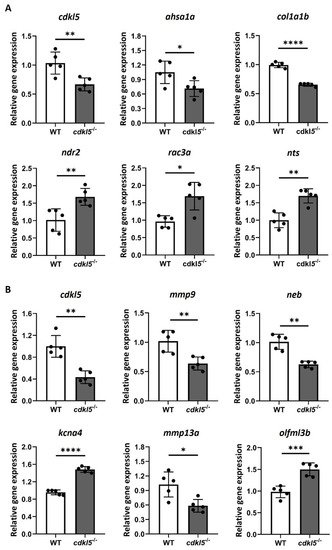
RT-qPCR analysis of a randomly selected set of DEG between |
Expression Data
| Genes: | |
|---|---|
| Fish: | |
| Anatomical Term: | |
| Stage Range: | Day 5 to Days 30-44 |
Expression Detail
Antibody Labeling
Phenotype Data
| Fish: | |
|---|---|
| Observed In: | |
| Stage Range: | Day 5 to Days 30-44 |
Phenotype Detail
Acknowledgments
This image is the copyrighted work of the attributed author or publisher, and
ZFIN has permission only to display this image to its users.
Additional permissions should be obtained from the applicable author or publisher of the image.
Full text @ Int. J. Mol. Sci.