
- Title
-
Transcriptional regulators with broad expression in the zebrafish spinal cord
- Authors
- England, S.J., Campbell, P.C., Banerjee, S., Bates, R.L., Grieb, G., Fancher, W.F., Lewis, K.E.
- Source
- Full text @ Dev. Dyn.
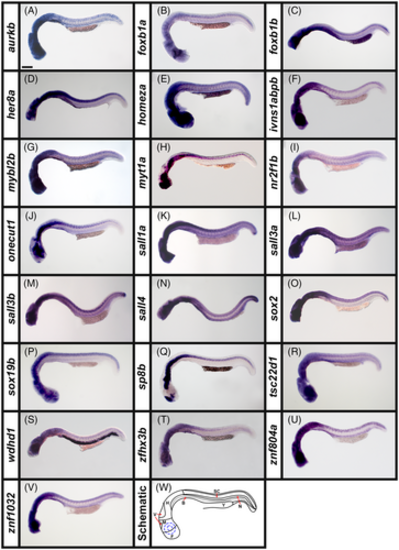
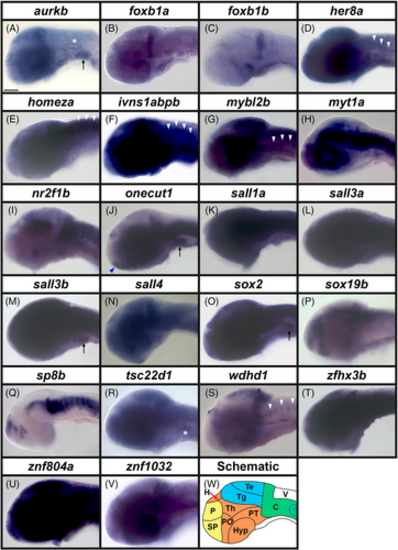
Broad expression of transcription factor and transcriptional regulator genes in wholemount zebrafish embryos at 24 h. (A–V) Lateral views of wholemount WT zebrafish embryos at 24 h. A minimum of five embryos were analyzed in detail per gene to determine the representative expression pattern (see Experimental Procedures for further details). (W) Schematic of a lateral view of a 24 h wholemount zebrafish embryo. F, forebrain, M, midbrain, H, hindbrain, V, mid- and hindbrain ventricles, SC, spinal cord, N, notochord, B, blood (black dotted line indicates boundary between dorsal aorta and cardinal vein), Y, yolk and the eye and lens are indicated with concentric blue dotted circles. In all panels, rostral is left and dorsal is up. Transcriptional regulator gene (A) aurkb, and transcription factor genes (B) foxb1a, (C) foxb1b, (D) her8a, (E) homeza, (F) ivns1abpb, (G) mybl2b, (H) myt1a, (I) nr2f1b, (J) onecut1, (K) sall1a, (L) sall3a, (M) sall3b, (N) sall4, (O) sox2 (P), sox19b, (Q) sp8b, (R) tsc22d1, (S) wdhd1, (T) zfhx3b, (U) znf804a, and (V) znf1032 are all broadly expressed throughout the rostro-caudal and dorso-ventral spinal cord and all 22 of these genes are also variably expressed in the brain. (A) aurkb, (F) ivns1abpb, (G) mybl2b, (N) sall4, (S) wdhd1, (U) znf804a, and (V) znf1032 are also variably expressed in the blood beneath the notochord. (N) sall4 in situ hybridization experiments were performed with the molecular crowding reagent Dextran Sulfate (see Experimental Procedures for rationale). All other in situ hybridization experiments in this figure were performed without this reagent. Scale bar: 200 μm. |

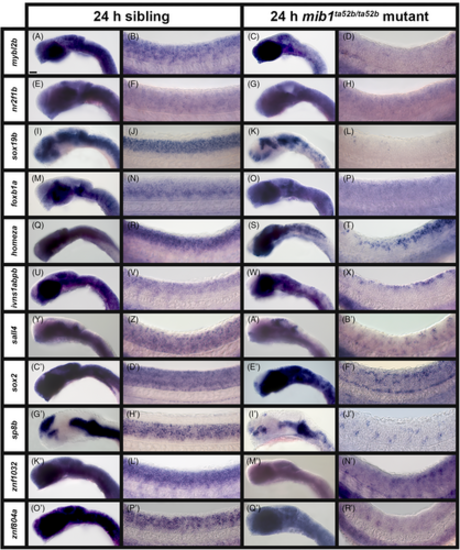
A subset of transcription factor and transcriptional regulator genes lose expression in the spinal cord of zebrafish mib1ta52b mutant embryos at 24 h. (A–Y) Lateral views of (A, C, F, H, K, M, P, R, U, W) head, (B, D, G, I, L, N, Q, S, V, X) spinal cord, and (E, J, O, T, Y) tail in (A, B, F, G, K, L, P, Q, U, V) sibling and (C–E, H–J, M–O, R–T, W–Y) mib1ta52b mutant embryos at 24 h. Rostral, left. Dorsal, up. A minimum of five embryos were analyzed per gene for each genotype to determine representative expression patterns (see Experimental Procedures). None of the in situ hybridization experiments in this figure were performed with the molecular crowding reagent Dextran Sulfate. Scale bar: (A, C, F, H, K, M, P, R, U, W) 50 μm, (B, D, G, I, L, N, Q, S, V, X) 20 μm, and (E, J, O, T, Y) 25 μm. |
A subset of transcription factor genes show reduced expression in the spinal cord of zebrafish mib1ta52b mutant embryos at 24 h. Lateral views of (A, C, E, G, I, K, M, O, Q, S, U, W, Y, A′, C′, E′, G′, I′, K′, M′, O′, Q′) head, and (B, D, F, H, J, L, N, P, R, T, V, X, Z, B′, D′, F′, H′, J′, L′, N′, P′, R′) spinal cord in (A, B, E, F, I, J, M, N, Q, R, U, V, Y, Z, C′, D′, G′, H′, K′, L′, O′, P′) sibling and (C, D, G, H, K, L, O, P, S, T, W, X, A′, B′, E′, F′, I′, J′, M′, N′, Q′, R′) mib1ta52b mutant embryos at 24 h. Rostral, left. Dorsal, up. A minimum of five embryos were analyzed per gene for each genotype to determine representative expression patterns (see Experimental Procedures). (Y–B′) sall4 in situ hybridization experiments were performed with the molecular crowding reagent Dextran Sulfate (see Experimental Procedures for rationale). All other in situ hybridization experiments in this figure were performed without this reagent. Scale bar: (A, C, E, G, I, K, M, O, Q, S, U, W, Y, A′, C′, E′, G′, I′, K′, M′, O′, Q′) 50 μm, (B, D, F, H, J, L, N, P, R, T, V, X, Z, B′, D′, F′, H′, J′, L′, N′, P′, R′) 20 μm. |
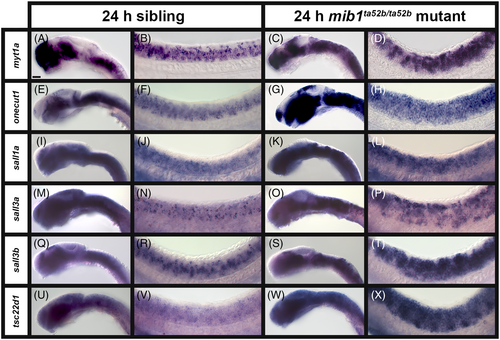
A subset of transcription factor genes show expanded expression in the spinal cord of zebrafish mib1ta52b mutant embryos at 24 h. Lateral views of (A, C, E, G, I, K, M, O, Q, S, U, W) head, and (B, D, F, H, J, L, N, P, R, T, V, X) spinal cord in (A, B, E, F, I, J, M, N, Q, R, U, V) sibling and (C, D, G, H, K, L, O, P, S, T, W, X) mib1ta52b mutant embryos at 24 h. Rostral, left. Dorsal, up. A minimum of five embryos were analyzed per gene for each genotype to determine representative expression patterns (see Experimental Procedures). In most of these cases, gene expression can be observed in additional spinal cord regions in mib1ta52b mutants compared to WT and sibling embryos, because of the expansion of specific populations of post-mitotic cells into neighboring locations along both dorsal-ventral and medial-lateral axes (see Figure 8). None of the in situ hybridization experiments in this figure were performed with the molecular crowding reagent Dextran Sulfate. Scale bar: (A, C, E, G, I, K, M, O, Q, S, U, W) 50 μm, (B, D, F, H, J, L, N, P, R, T, V, X) 20 μm. |
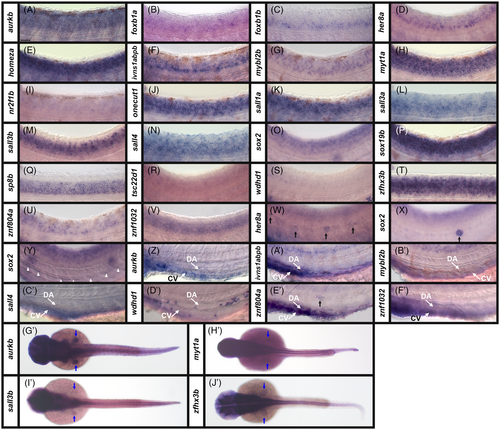
Transcription factor and transcriptional regulator gene expression in zebrafish spinal cord and mesendodermal tissues at 36 h. Lateral (A–F′) views of spinal cord (A–V), neuromasts of the lateral line primordium (W, X, E′), the hypochord (Y), and the blood (Z–F′) in WT zebrafish embryos at 36 h. Rostral, left. Dorsal, up. (G'-J') Dorsal wholemount views of WT zebrafish embryos at 36 h. Rostral, left. A minimum of five embryos were analyzed per gene to determine the representative expression pattern (see Experimental Procedures). (A–V) In the spinal cord views, the morphological boundary between the ventral spinal cord and the notochord is visible toward the bottom of the panel and the spinal cord is in focus. In panels (W, X, E′) the focal plane is more lateral, and the somites and lateral line primordium are in focus. Black arrows (W, X, E′) indicate neuromasts, deposited at intervals along the length of the embryo by the migrating lateral line primordium. White arrowheads (Y) indicate the hypochord, at the ventral interface between the notochord and the blood. (Z–F′) Expression in the blood is observed in the dorsal aorta (DA, white arrow) and cardinal vein (CV, white arrow), beneath the notochord. (G′–J′) Expression in the pectoral fin buds is indicated (blue arrows). in situ hybridization experiments with (L) sall3a, (M, I′) sall3b, (N, C′) sall4, and (T, J′) zfhx3b were performed with the molecular crowding reagent Dextran Sulfate (see Experimental Procedures for rationale). All other in situ hybridization experiments in this figure were performed without this reagent. Scale bar: (A–F′) 30 μm, (G′–J′) 130 μm EXPRESSION / LABELING:
|
Transcription factor and transcriptional regulator gene expression in zebrafish brain at 36 h. (A–V) Lateral views of heads in WT zebrafish embryos at 36 h. A minimum of five embryos were analyzed per gene (see Experimental Procedures for further details). (W) Schematic of a lateral view of the head of a 36 h zebrafish embryo. The telencephalon (dorsal forebrain, yellow) consists dorsally and ventrally of the pallium (P) and subpallium (SP) respectively. The diencephalon (ventral forebrain, orange) consists of the habenula (H), the hypothalamus (Hyp), the thalamic region (Th), the posterior tuberculum (PT) and the preoptic region (PO). The midbrain (blue) consists dorsally and ventrally of the tectum (Te) and the tegmentum (Tg), respectively. The hindbrain (green) consists of the cerebellum (C). V, ventricle in the hindbrain. Black dotted line = midbrain-hindbrain boundary. Blue dotted lines = otic vesicle. Transcriptional regulator gene (A) aurkb, and transcription factor genes (B) foxb1a, (C) foxb1b, (D) her8a, (E) homeza, (F) ivns1abpb, (G) mybl2b, (H) myt1a, (I) nr2f1b, (J) onecut1, (K) sall1a, (L) sall3a, (M) sall3b, (N) sall4, (O) sox2 (P), sox19b, (Q) sp8b, (R) tsc22d1, (S) wdhd1, (T) zfhx3b, (U) znf804a, and (V) znf1032 are all variably expressed in the brain. (D, E, F, G, S) White arrowheads depict weak expression in the rhomobomeres of the hindbrain. (A, R) aurkb and tsc22d1 are expressed in the otic vesicles (white asterisks). (A, J, M, O) aurkb, onecut1, sall3b and sox2 are expressed in the branchial (gill) mesenchyme (black arrow). (J and data not shown) onecut1 and sp8b are expressed in the olfactory bulbs (blue arrowhead). (N) sall4 in situ hybridization experiments were performed with the molecular crowding reagent Dextran Sulfate (see Experimental Procedures for rationale). All other in situ hybridization experiments in this figure were performed without this reagent. Scale bar: 100 μm. EXPRESSION / LABELING:
|
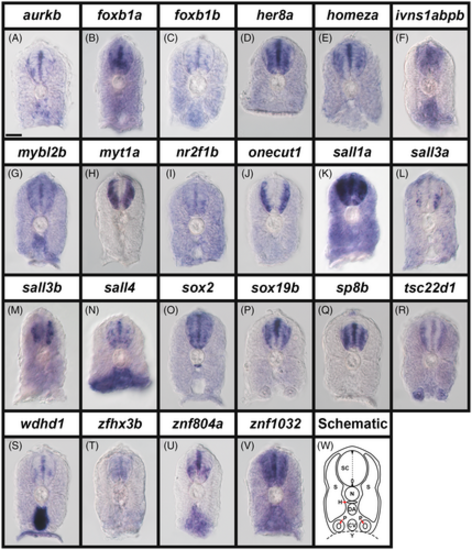
Broad expression of transcription factor and transcriptional regulator genes in zebrafish spinal cord at 24 h. (A–V) Cross-section views of trunk expression of transcriptional regulator gene (A) aurkb, and transcription factor genes (B) foxb1a, (C) foxb1b, (D) her8a, (E) homeza, (F) ivns1abpb, (G) mybl2b, (H) myt1a, (I) nr2f1b, (J) onecut1, (K) sall1a, (L) sall3a, (M) sall3b, (N) sall4, (O) sox2, (P) sox19b, (Q) sp8b, (R) tsc22d1, (S) wdhd1, (T) zfhx3b, (U) znf804a, and (V) znf1032 in WT zebrafish embryos at 24 h. Dorsal, up. A minimum of five embryos were analyzed per gene to determine the representative expression pattern (see Experimental Procedures). As indicated in the schematic cross-section (W), the spinal cord (SC), is located above the notochord (N), which is above the hypochord (H, indicated with red arrow), dorsal aorta (DA), and the cardinal vein (CV). The somites (S) can be seen on both sides of these tissues and the pronephros tubes (P, indicated with red arrows) are ventral, either side of the cardinal vein. Within the spinal cord, the dotted line indicates the midline, the small oval indicates the central canal and the small black triangles indicate the roof plate and floor plate. (N) sall4 in situ hybridization experiments were performed with the molecular crowding reagent Dextran Sulfate (see Experimental Procedures for rationale). All other in situ hybridization experiments in this figure were performed without this reagent. Scale bar: 30 μm. EXPRESSION / LABELING:
|
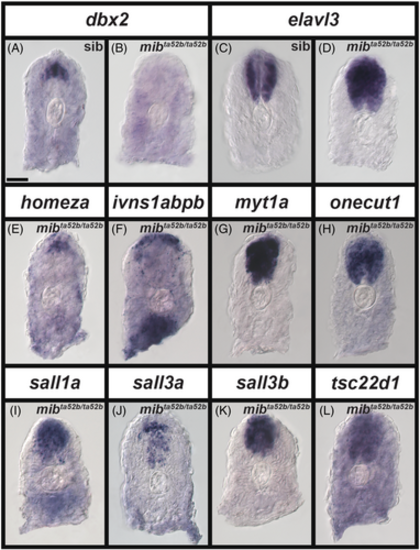
Expression of a subset of transcription factor genes is either lost in progenitor domains and/or expanded in post-mitotic domains in the spinal cord of zebrafish mib1ta52b mutant embryos at 24 h. (A–L) Cross-section views of trunk expression of transcription factor genes (A, B) dbx2 (expressed in a spinal cord progenitor domain), (C, D) elavl3 (expressed by all spinal cord post-mitotic cells), (E) homeza, (F) ivns1abpb, (G) myt1a, (H) onecut1, (I) sall1a, (J) sall3a, (K) sall3b, and (L) tsc22d1 in (A, C) sibling and (B, D, E, F, G, H, I, J, K, L) mib1ta52b mutant embryos at 24 h. Dorsal, up. A minimum of five embryos were analyzed per gene per genotype to determine representative expression patterns (see Experimental Procedures). For schematic, please see Figure 7W. The expression patterns of homeza, ivns1abpb, myt1a, onecut1, sall1a, sall3a, sall3b, and tsc22d1 in sibling spinal cords at 24 h (data not shown) is identical to that in 24 h WT embryos shown in Figure 7. None of the in situ hybridization experiments in this figure were performed with the molecular crowding reagent Dextran Sulfate. Scale bar: 30 μm. |