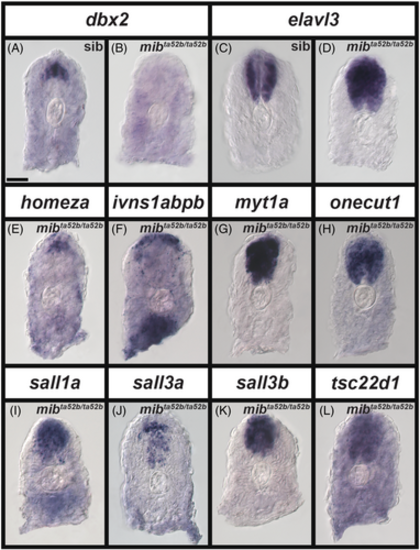
Expression of a subset of transcription factor genes is either lost in progenitor domains and/or expanded in post-mitotic domains in the spinal cord of zebrafish mib1ta52b mutant embryos at 24 h. (A–L) Cross-section views of trunk expression of transcription factor genes (A, B) dbx2 (expressed in a spinal cord progenitor domain), (C, D) elavl3 (expressed by all spinal cord post-mitotic cells), (E) homeza, (F) ivns1abpb, (G) myt1a, (H) onecut1, (I) sall1a, (J) sall3a, (K) sall3b, and (L) tsc22d1 in (A, C) sibling and (B, D, E, F, G, H, I, J, K, L) mib1ta52b mutant embryos at 24 h. Dorsal, up. A minimum of five embryos were analyzed per gene per genotype to determine representative expression patterns (see Experimental Procedures). For schematic, please see Figure 7W. The expression patterns of homeza, ivns1abpb, myt1a, onecut1, sall1a, sall3a, sall3b, and tsc22d1 in sibling spinal cords at 24 h (data not shown) is identical to that in 24 h WT embryos shown in Figure 7. None of the in situ hybridization experiments in this figure were performed with the molecular crowding reagent Dextran Sulfate. Scale bar: 30 μm.
|
