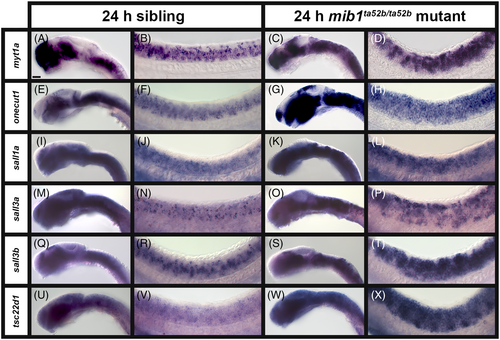
A subset of transcription factor genes show expanded expression in the spinal cord of zebrafish mib1ta52b mutant embryos at 24 h. Lateral views of (A, C, E, G, I, K, M, O, Q, S, U, W) head, and (B, D, F, H, J, L, N, P, R, T, V, X) spinal cord in (A, B, E, F, I, J, M, N, Q, R, U, V) sibling and (C, D, G, H, K, L, O, P, S, T, W, X) mib1ta52b mutant embryos at 24 h. Rostral, left. Dorsal, up. A minimum of five embryos were analyzed per gene for each genotype to determine representative expression patterns (see Experimental Procedures). In most of these cases, gene expression can be observed in additional spinal cord regions in mib1ta52b mutants compared to WT and sibling embryos, because of the expansion of specific populations of post-mitotic cells into neighboring locations along both dorsal-ventral and medial-lateral axes (see Figure 8). None of the in situ hybridization experiments in this figure were performed with the molecular crowding reagent Dextran Sulfate. Scale bar: (A, C, E, G, I, K, M, O, Q, S, U, W) 50 μm, (B, D, F, H, J, L, N, P, R, T, V, X) 20 μm.
|
