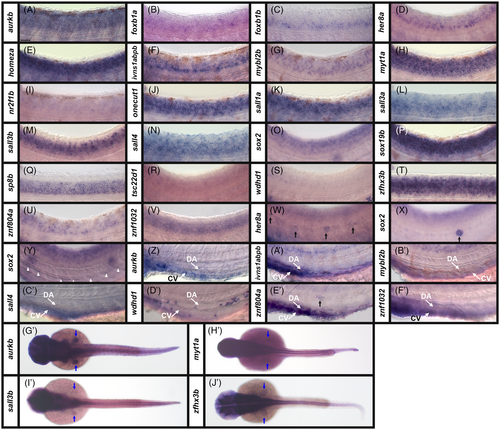
Transcription factor and transcriptional regulator gene expression in zebrafish spinal cord and mesendodermal tissues at 36 h. Lateral (A–F′) views of spinal cord (A–V), neuromasts of the lateral line primordium (W, X, E′), the hypochord (Y), and the blood (Z–F′) in WT zebrafish embryos at 36 h. Rostral, left. Dorsal, up. (G'-J') Dorsal wholemount views of WT zebrafish embryos at 36 h. Rostral, left. A minimum of five embryos were analyzed per gene to determine the representative expression pattern (see Experimental Procedures). (A–V) In the spinal cord views, the morphological boundary between the ventral spinal cord and the notochord is visible toward the bottom of the panel and the spinal cord is in focus. In panels (W, X, E′) the focal plane is more lateral, and the somites and lateral line primordium are in focus. Black arrows (W, X, E′) indicate neuromasts, deposited at intervals along the length of the embryo by the migrating lateral line primordium. White arrowheads (Y) indicate the hypochord, at the ventral interface between the notochord and the blood. (Z–F′) Expression in the blood is observed in the dorsal aorta (DA, white arrow) and cardinal vein (CV, white arrow), beneath the notochord. (G′–J′) Expression in the pectoral fin buds is indicated (blue arrows). in situ hybridization experiments with (L) sall3a, (M, I′) sall3b, (N, C′) sall4, and (T, J′) zfhx3b were performed with the molecular crowding reagent Dextran Sulfate (see Experimental Procedures for rationale). All other in situ hybridization experiments in this figure were performed without this reagent. Scale bar: (A–F′) 30 μm, (G′–J′) 130 μm
|
