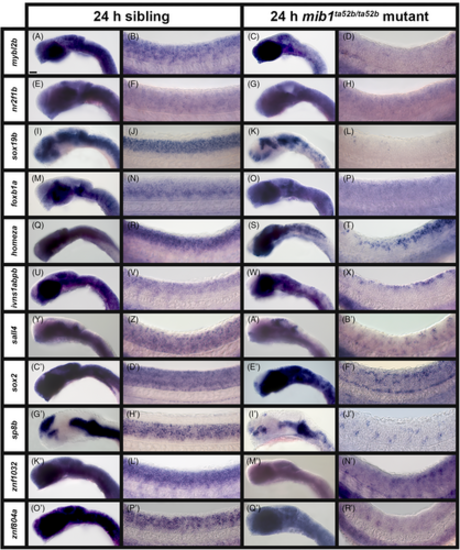
A subset of transcription factor genes show reduced expression in the spinal cord of zebrafish mib1ta52b mutant embryos at 24 h. Lateral views of (A, C, E, G, I, K, M, O, Q, S, U, W, Y, A′, C′, E′, G′, I′, K′, M′, O′, Q′) head, and (B, D, F, H, J, L, N, P, R, T, V, X, Z, B′, D′, F′, H′, J′, L′, N′, P′, R′) spinal cord in (A, B, E, F, I, J, M, N, Q, R, U, V, Y, Z, C′, D′, G′, H′, K′, L′, O′, P′) sibling and (C, D, G, H, K, L, O, P, S, T, W, X, A′, B′, E′, F′, I′, J′, M′, N′, Q′, R′) mib1ta52b mutant embryos at 24 h. Rostral, left. Dorsal, up. A minimum of five embryos were analyzed per gene for each genotype to determine representative expression patterns (see Experimental Procedures). (Y–B′) sall4 in situ hybridization experiments were performed with the molecular crowding reagent Dextran Sulfate (see Experimental Procedures for rationale). All other in situ hybridization experiments in this figure were performed without this reagent. Scale bar: (A, C, E, G, I, K, M, O, Q, S, U, W, Y, A′, C′, E′, G′, I′, K′, M′, O′, Q′) 50 μm, (B, D, F, H, J, L, N, P, R, T, V, X, Z, B′, D′, F′, H′, J′, L′, N′, P′, R′) 20 μm.
|
