
- Title
-
Pitx2c orchestrates embryonic axis extension via mesendodermal cell migration
- Authors
- Collins, M.M., Maischein, H.M., Dufourcq, P., Charpentier, M., Blader, P., Stainier, D.Y.
- Source
- Full text @ Elife
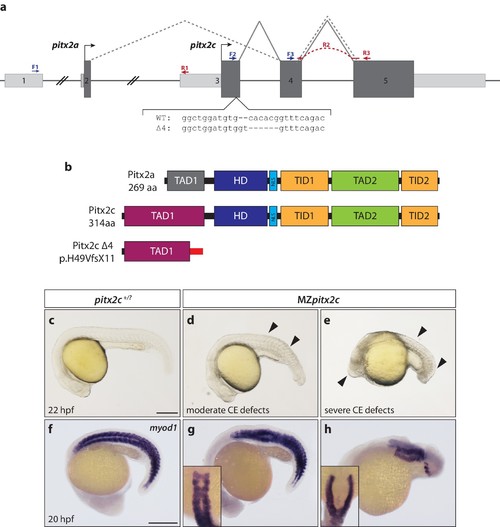
Maternal and zygotic Pitx2c function are required for embryonic development. (a) Schematic of the zebrafish pitx2 locus including the sequence of the Δ4 allele. The location of forward (F) and reverse (R) primers used for qPCR are indicated in blue and red, respectively. The red dashed line for R2 indicates primer binding on the 3’ end of exon 4 and the 5’ end of exon 5. The gray dashed line indicates splicing of the pitx2a isoform, while the solid line indicates splicing of the pitx2c isoform. (b) Schematic of the domains of Pitx2a, Pitx2c, and the predicted truncated protein generated from the Δ4 transcript. (c–h) Phenotypes observed in MZpitx2c mutant embryos obtained from homozygous mutant incrosses compared to wild-type embryos. MZpitx2c mutant phenotypes are variable and can be classified into three groups: Class I embryos exhibit somite defects (d, g); Class II embryos exhibit severe axis shortening and other malformations suggestive of convergence and extension (CE) defects (e, h); Class III embryos exhibit no obvious morphological defects (not shown). HD: homeodomain; NLS, nuclear localization signal; TAD: transactivation domain; TID, transactivation inhibitory domain. Scale bars, 250 μm. EXPRESSION / LABELING:
PHENOTYPE:
|

Maternal and zygotic expression of pitx2c. (a–h) Analysis of the pitx2c mRNA expression pattern from the 2 cell stage to 90% epiboly by in situ hybridization (a–f) and qPCR (g) reveals low levels of maternal contribution followed by an increase throughout gastrulation and somitogenesis. qPCR was performed using primers F2 and R2 (Figure 1a). Average Ct values obtained at each stage are indicated in grey at the bottom of the graph. At the onset of gastrulation, pitx2c expression is detected at the margin (a, b). Expression of pitx2c at 90% epiboly in wild-type embryos (e) and embryos lacking endoderm (sox32 morphants) (f) is indistinguishable, indicating that pitx2c is mainly expressed in mesodermal cells. (h) Database analysis of Ensembl-curated transcriptomic resources showing log2-fold change in expression level for pitx2 (green line) and two nodal genes, ndr1 (brown line) and ndr2 (gray line). Very low levels (<5 RPKM) of pitx2c transcript are reported in available RNAseq datasets at the 1 cell to 1000 cell stage. qPCR analysis for pitx2c expression (g) reflects the dynamic expression reported in available transcriptomic databases (h). b: animal pole view, dorsal to the right; c-f: lateral views, dorsal to the right. Scale bar, 100 μm. EXPRESSION / LABELING:
|
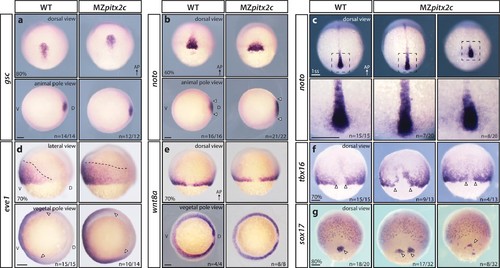
MZpitx2c mutants are correctly patterned but exhibit defects in spatial organization. (a–g) Analysis of goosecoid (gsc) (a), noto/flh (b, c), eve1 (d), wnt8a (e), tbx16 (f), and sox17 (g) expression by in situ hybridization. Expression of gsc (dorsal organizer) at 80% epiboly is indistinguishable between MZpitx2c mutants and wild types (a). At 60% epiboly, MZpitx2c mutants display an expanded domain of noto expression (axial mesoderm) (b) and subsequently a shorter and wider notochord at the one somite stage (ss) (c). A higher magnification of the boxed regions in panel c is shown in the lower panels. The eve1 expression domain (ventral mesoderm) is expanded dorsally in MZpitx2c mutants (d) (outlined by dashed lines and indicated by arrows in the vegetal pole views), and no obvious changes were observed in wnt8a expression (embryonic margin) (e). Expression of tbx16 (paraxial mesoderm) is disrupted in the dorsal region of MZpitx2c mutants (f). Expression of sox17 (endoderm) reveals defects in dorsal forerunner cell migration (arrowheads) in 80% epiboly MZpitx2c mutants (g). a-c and e-g: dorsal views, animal pole to the top; a-b: animal pole views, dorsal to the right of the image; d: lateral views, dorsal to the right of the image; d-e: vegetal pole views, dorsal to the right of the image. ‘n’ refers to the number of embryos with the expression pattern shown over the total number of embryos analyzed. AP, animal pole; D, dorsal; V, ventral. Scale bars, 100 μm. EXPRESSION / LABELING:
PHENOTYPE:
|
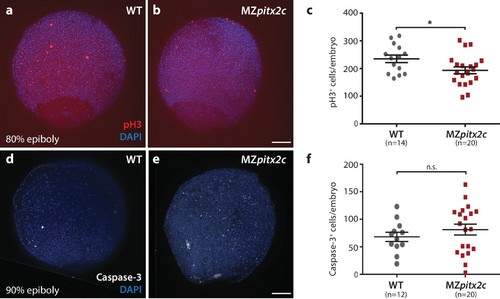
Proliferation is reduced in MZpitx2c mutant embryos during gastrulation. (a, b) Immunostaining of wild-type (a) and MZpitx2c mutant (b) embryos for phospho-Histone H3 (pH3) and counterstaining with DAPI to visualize nuclei. (c) Quantification of the number of pH3+ cells in wild-type and MZpitx2c mutant embryos at 80–90% epiboly. (d, e) Immunostaining of wild-type (d) and MZpitx2c mutant (e) embryos for cleaved Caspase-3 and counterstaining with DAPI to visualize nuclei. (f) Quantification of the number of Caspase-3+ cells in wild-type and MZpitx2c mutant embryos at 80–90% epiboly. Scale bars, 100 μm. *p<0.05 by unpaired t-test. |

MZpitx2c mutants exhibit defects in convergence and extension of mesendodermal cells. (a–c) In situ hybridization for hgg1 (prechordal plate) and noto/flh (notochord) expression at tailbud. Quantification of the distance between the hgg1 and noto domains is shown in (c); the distance measured is indicated by the lines shown in panels a and b. (d–f) Analysis of cell shapes in the notochord by mosaically labelling cells with membrane tdTomato and nuclear H2B-GFP. Quantification of the ratio between the mediolateral (ML) width and anterior-posterior (AP) length of cells in the notochord is shown in (f); n > 60 cells from at least four embryos. MZpitx2c mutants exhibit a reduced distance between the prechordal plate and notochord (b, c), and axial mesodermal cells of the notochord fail to intercalate and elongate mediolaterally (e, f), indicative of defects in mesodermal convergence and axis extension. (g–i) Analysis of lateral mesendodermal migration. Embryos were injected with photoconvertible kikGR mRNA at the 1 cell stage; a 100 μm2 region of mesendodermal cells located 90° from the dorsal organizer was photoconverted at shield stage and the photoconverted population was tracked until 90% epiboly (g, h). To quantify the extent of anterior migration, the length of the photoconverted population was measured (shown by the blue dashed lines) (i). Convergence towards the dorsal midline (shown by the yellow dashed lines) was assessed by measuring the circumferential angle of the location of the dorsal-most photoconverted cells from the dorsal midline (j). MZpitx2c mutants exhibit reduced dorsal convergence as well as reduced anterior extension of lateral mesendodermal cells during late gastrulation when compared to wild types (i, j). a-b, d-e: dorsal views, animal pole to the top; g-h: lateral views, dorsal to the right of the image. D, dorsal. **p<0.01, ****p<0.0001 by unpaired t-test. Scale bars, 100 μm (a, g) or 10 μm (d). EXPRESSION / LABELING:
PHENOTYPE:
|
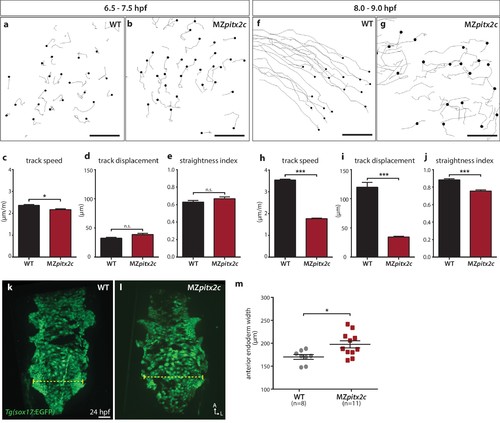
Pitx2c promotes oriented, persistent endodermal cell migration. (a–e) Time-lapse imaging was performed to assess the early migration (random walk pattern from 6.5 to 7.5 hpf) and (f–j) late migration (oriented and persistent pattern from 8 to 9 hpf) of endodermal cells labelled by Tg(sox17:GFP) expression. Representative tracks of endodermal cells are shown from 6.5 to 7.5 hpf (a, b) and from 8 to 9 hpf (f, g) from wild-type and MZpitx2c mutant embryos. Quantification of speed (c, h), track displacement (d, i), and track straightness (e, j) from wild-type and MZpitx2c mutant embryos are shown in the graphs below (n > 3 embryos, 20–40 tracks per embryo). While early random walk motions are similar to wild types (a–e), later endodermal cell persistence and directional migration are significantly affected in MZpitx2c mutants (f–j). (k–m) Analysis of anterior endodermal derivatives at 24 hpf in wild-type (k) and MZpitx2c mutant (l) embryos. The width of the endoderm (shown by the yellow dashed lines) was measured at the level of the fifth pharyngeal pouch and quantified from at least eight embryos (m). Increased endoderm width is observed in MZpitx2c mutants compared to wild types. *p<0.05, ***p<0.001 by unpaired t-test. Scale bars, 40 μm. |
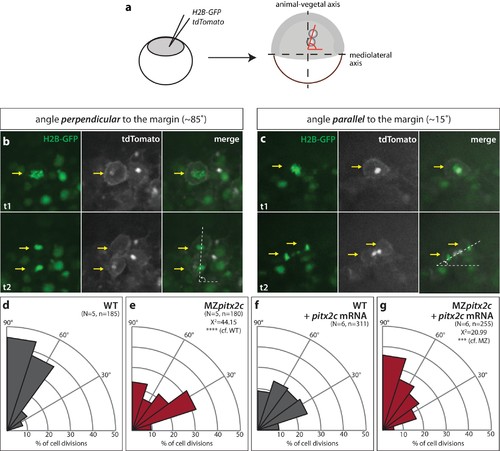
Modulation of pitx2c expression affects cell division orientation during gastrulation. (a) Schematic of the experimental design to assess the orientation of cell division in the embryo. Embryos were injected at the 1 cell stage with H2B-GFP and membrane tdTomato mRNA. Time-lapse imaging was performed from shield stage for 90 mins; quantification was performed on at least five embryos per condition with 30–60 cell divisions counted per embryo. (b) Example of a cell division oriented perpendicular to the mediolateral (ML) axis shown at two consecutive time points, t1 (upper panel) and t2 (lower panel). (c) Example of a cell division oriented parallel to the ML axis shown at two consecutive time points, t1 and t2. Yellow arrows point to the particular cell division that is measured by the white dashed lines. All images are oriented with dorsal to the right, animal pole to the top. (d–g) Rose diagrams indicating the orientation of cell division axes in wild types (d) and MZpitx2c mutants (e), and after injection of pitx2c mRNA at the 1 cell stage in wild types (f) and MZpitx2c mutants (g). The proportion of cell division angles is indicated relative to the ML axis. MZpitx2c mutants exhibit a higher proportion of cell divisions oriented less than 45° from the ML axis (e) as compared to wild-type embryos (d). Injection of 25 pg of pitx2c mRNA at the 1 cell stage randomizes cell division orientation in wild-type embryos (f), whereas it increases the proportion of cell divisions occurring perpendicular to the ML axis in MZpitx2c mutant embryos (g). Chi-square tests were performed on binned data of cell division angles. |
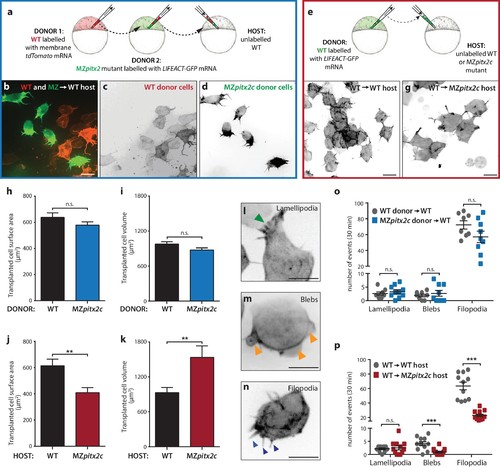
Pitx2c functions cell non-autonomously to promote convergence and extension during gastrulation. (a–d) Wild-type donor cells labelled with membrane tdTomato mRNA and MZpitx2c donor cells labelled with LIFEACT-GFP mRNA were transplanted into wild-type host embryos. Live imaging of successfully transplanted hosts was performed from 70–90% epiboly. (e–g) Wild-type donor cells labelled with LIFEACT-GFP mRNA were transplanted into wild-type (f) or MZpitx2c mutant (g) host embryos. (h–k) Analysis of transplanted cell surface area and cell volume in the different transplantation approaches shown in panel a (h, i) and panel e (j, k). No differences in cell surface area or volume were observed between wild-type and MZpitx2c mutant donor cells transplanted into a wild-type host (h, i). In contrast, wild-type cells transplanted into a MZpitx2c mutant host appeared flattened, with a larger surface area and reduced volume, as compared to cells transplanted into a wild-type host (j, k). (l–p) Quantification of protrusions during mesendodermal migration in the different transplantation approaches shown in panel a (o) and panel e (p). Examples of lamellipodia (l; green arrowheads), blebs (m; orange arrowheads), and filopodia (n; blue arrowheads) formed during mesendodermal migration. The number of each type of protrusions observed over a 30 min period was quantified at late gastrulation (70–90% epiboly) (n > 10 cells from at least three embryos). Wild-type cells transplanted into mutant hosts exhibit less protrusive behavior (p) than wild-type cells transplanted into wild-type hosts. **p<0.01, ***p<0.001 by unpaired t-test. Scale bars, 10 μm. |
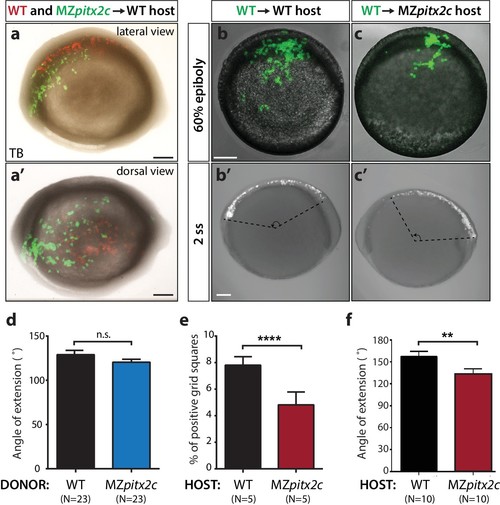
Analysis of cell autonomy. (a, a’) Transplants of cells from a MZpitx2c mutant donor labelled with LIFEACT-GFP mRNA and wild-type donor labelled with membrane tdTomato mRNA into an unlabelled wild-type host embryo, imaged at tailbud (TB). (b, c) Transplants of cells from a wild-type donor labelled with FITC dextran into an unlabelled wild-type (b) or MZpitx2c mutant (c) host, imaged at 60% epiboly (b, c) and two ss (b’, c’); different embryos are shown at 60% epiboly and two ss. (d) Quantification of the spread of transplanted wild-type and MZpitx2c donor cells along the AP axis of a wild-type host embryo. (e) Quantification of the dispersal of transplanted wild-type donor cells into wild-type or MZpitx2c mutant hosts and imaged at 60% epiboly. To quantify, images were overlaid with a grid and the number of squares containing at least one GFP+ cell was determined (e). (f) Quantification of the spread of transplanted wild-type donor cells along the AP axis of a wild-type or MZpitx2c mutant host embryo. Graphs indicate the average ± SEM. a-c: lateral views, anterior (A) to the left. a': dorsal view, anterior to the left. *p<0.05, ****p<0.0001 by unpaired t-test. Scale bars, 100 μm. |
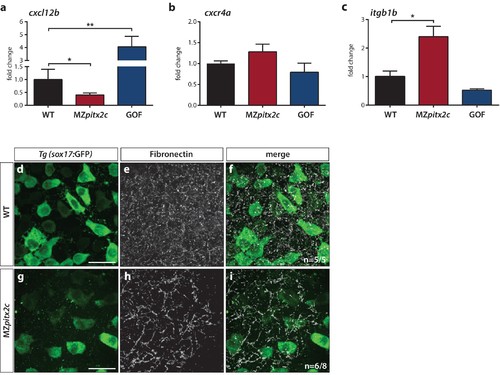
Pitx2c modulates the chemokine and ECM-integrin signaling axis. Analysis of the chemokine signaling axis and ECM factors that control endodermal migration. (a–c) qPCR analysis of cxcl12b (a), cxcr4a (b), and itgb1b (c) mRNA levels in wild-type, MZpitx2c mutant, and pitx2c GOF embryos at 80% epiboly. (d–i) Fibronectin staining in wild-type (d–f) and MZpitx2c mutant (g–i) embryos in the Tg(sox17:GFP) background to visualize endodermal cells. While fibronectin deposition appears fibrillar by the two ss in wild-type embryos (e), a less dense network is observed in MZpitx2c mutants (h). ‘n’ refers to the number of embryos with the expression pattern shown over the total number of embryos analyzed. *p<0.05, **p<0.01 by unpaired t-test. Graphs indicate the average fold change ± SEM from at least three biological replicates analyzed in duplicates. Scale bars, 20 μm. EXPRESSION / LABELING:
PHENOTYPE:
|

ZFIN is incorporating published figure images and captions as part of an ongoing project. Figures from some publications have not yet been curated, or are not available for display because of copyright restrictions. EXPRESSION / LABELING:
PHENOTYPE:
|
|
Unillustrated author statements PHENOTYPE:
|