
Fig. 2-S1
- ID
- ZDB-IMAGE-180824-16
- Publication
- Collins et al., 2018 - Pitx2c orchestrates embryonic axis extension via mesendodermal cell migration
- All Figures
- Figures for Collins et al., 2018
|
Fig. 2-S1
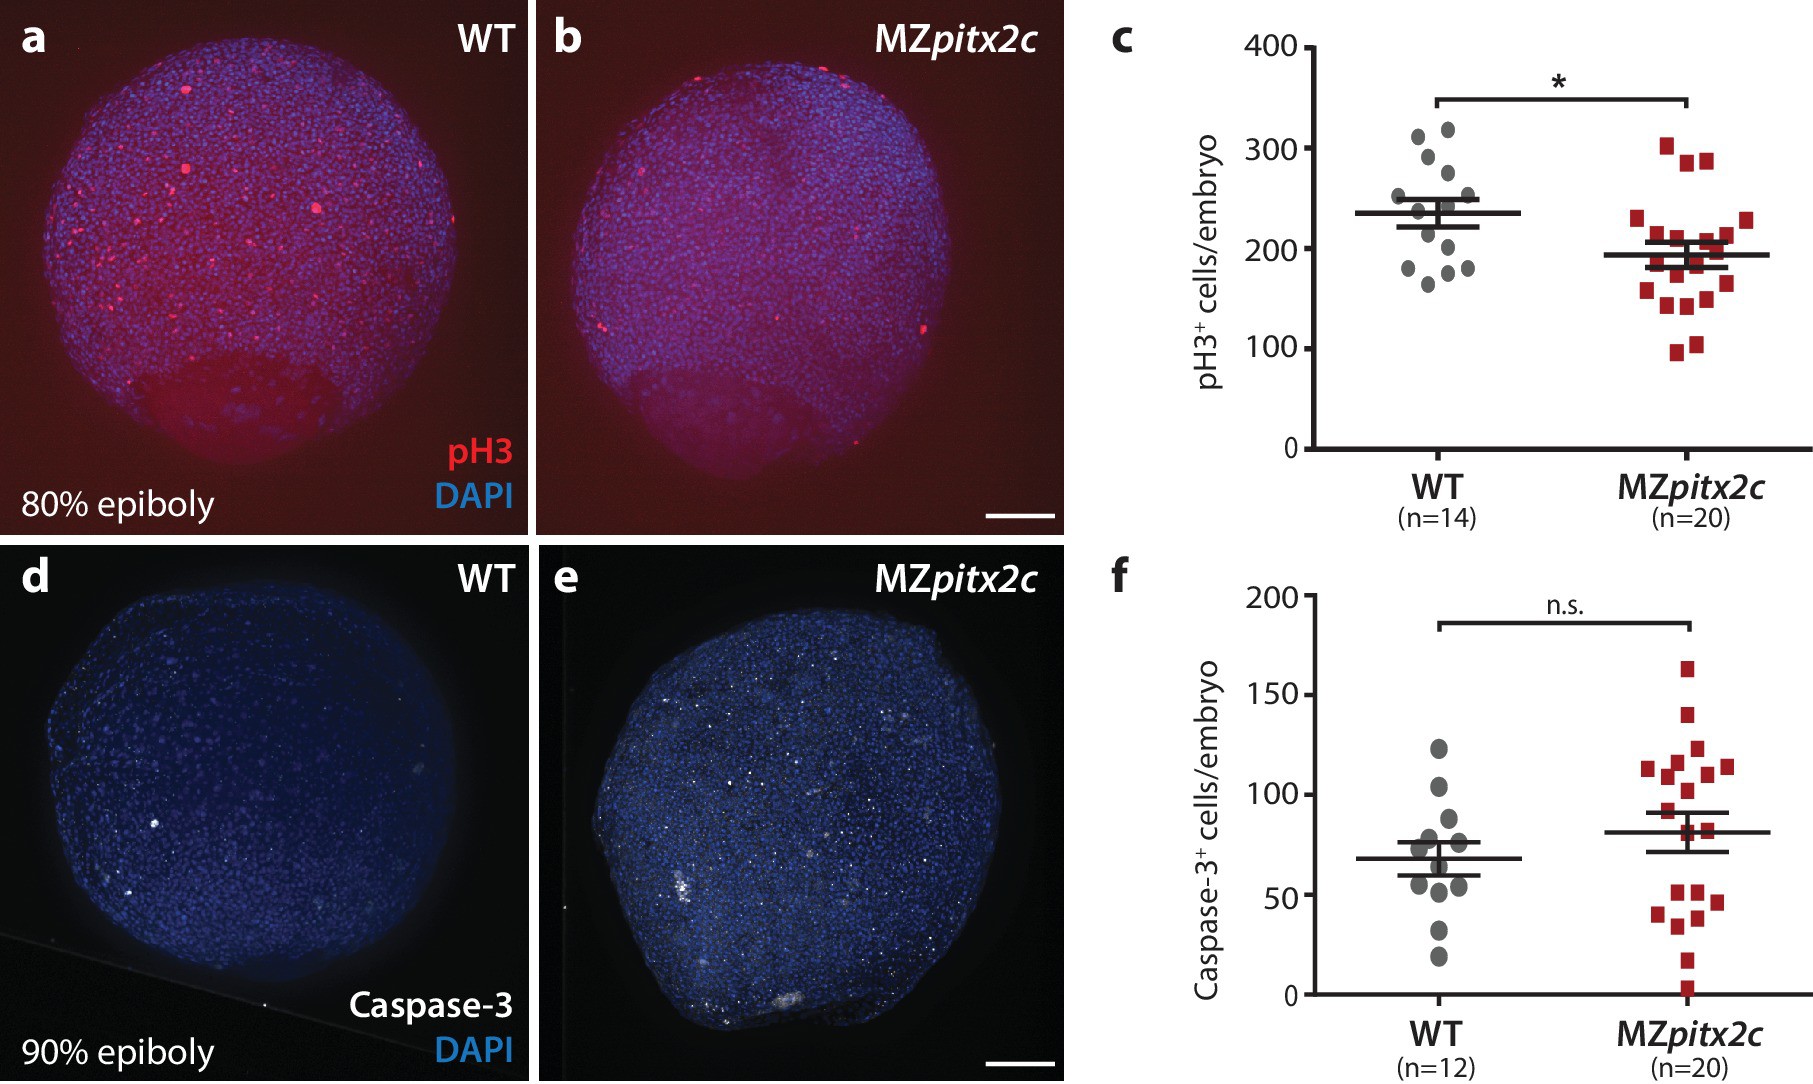
Proliferation is reduced in MZpitx2c mutant embryos during gastrulation.
(a, b) Immunostaining of wild-type (a) and MZpitx2c mutant (b) embryos for phospho-Histone H3 (pH3) and counterstaining with DAPI to visualize nuclei. (c) Quantification of the number of pH3+ cells in wild-type and MZpitx2c mutant embryos at 80–90% epiboly. (d, e) Immunostaining of wild-type (d) and MZpitx2c mutant (e) embryos for cleaved Caspase-3 and counterstaining with DAPI to visualize nuclei. (f) Quantification of the number of Caspase-3+ cells in wild-type and MZpitx2c mutant embryos at 80–90% epiboly. Scale bars, 100 μm. *p<0.05 by unpaired t-test.