
Fig. 7
- ID
- ZDB-IMAGE-180824-22
- Genes
- Antibodies
- Publication
- Collins et al., 2018 - Pitx2c orchestrates embryonic axis extension via mesendodermal cell migration
- All Figures
- Figures for Collins et al., 2018
|
Fig. 7
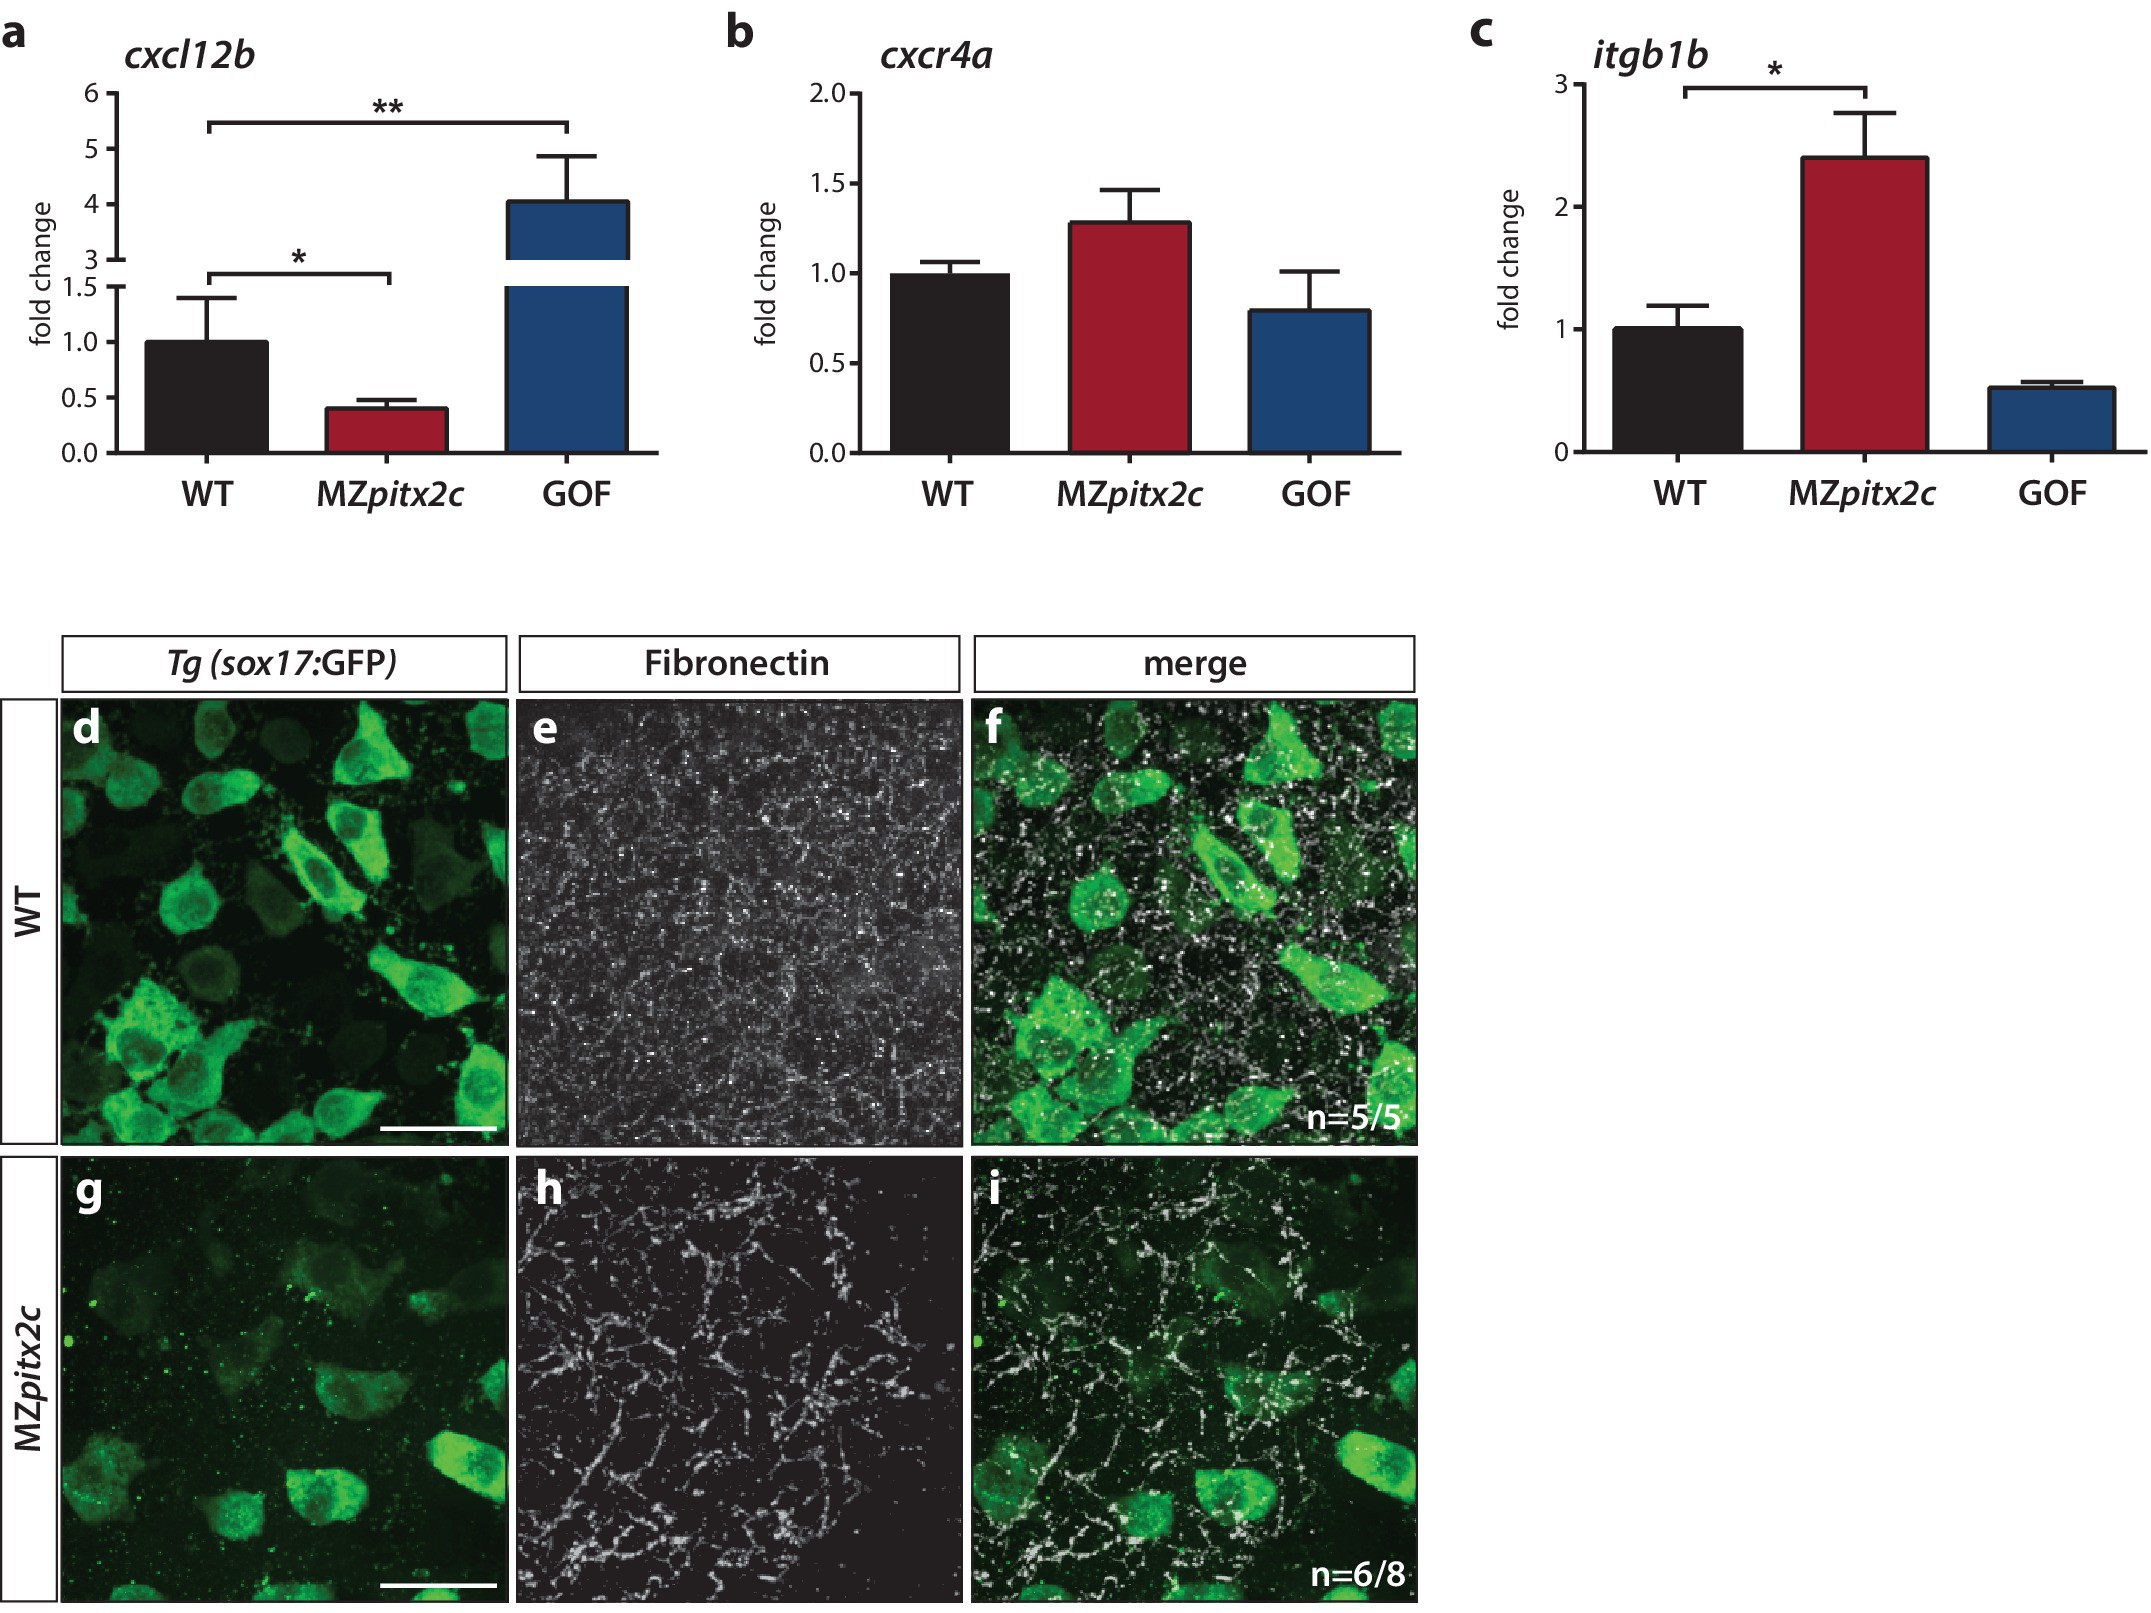
Pitx2c modulates the chemokine and ECM-integrin signaling axis.
Analysis of the chemokine signaling axis and ECM factors that control endodermal migration. (a–c) qPCR analysis of cxcl12b (a), cxcr4a (b), and itgb1b (c) mRNA levels in wild-type, MZpitx2c mutant, and pitx2c GOF embryos at 80% epiboly. (d–i) Fibronectin staining in wild-type (d–f) and MZpitx2c mutant (g–i) embryos in the Tg(sox17:GFP) background to visualize endodermal cells. While fibronectin deposition appears fibrillar by the two ss in wild-type embryos (e), a less dense network is observed in MZpitx2c mutants (h). ‘n’ refers to the number of embryos with the expression pattern shown over the total number of embryos analyzed. *p<0.05, **p<0.01 by unpaired t-test. Graphs indicate the average fold change ± SEM from at least three biological replicates analyzed in duplicates. Scale bars, 20 μm.