
Fig. 6-S1
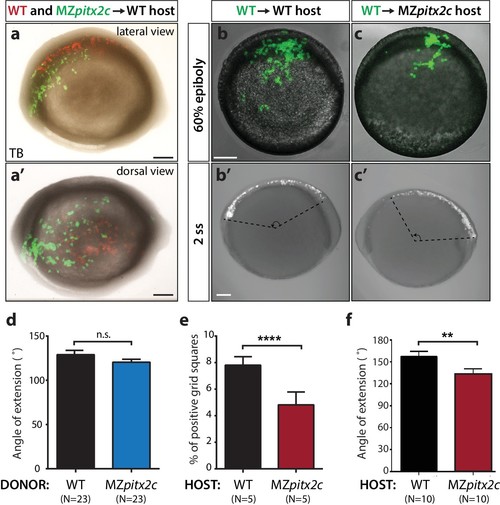
Analysis of cell autonomy. (a, a’) Transplants of cells from a MZpitx2c mutant donor labelled with LIFEACT-GFP mRNA and wild-type donor labelled with membrane tdTomato mRNA into an unlabelled wild-type host embryo, imaged at tailbud (TB). (b, c) Transplants of cells from a wild-type donor labelled with FITC dextran into an unlabelled wild-type (b) or MZpitx2c mutant (c) host, imaged at 60% epiboly (b, c) and two ss (b’, c’); different embryos are shown at 60% epiboly and two ss. (d) Quantification of the spread of transplanted wild-type and MZpitx2c donor cells along the AP axis of a wild-type host embryo. (e) Quantification of the dispersal of transplanted wild-type donor cells into wild-type or MZpitx2c mutant hosts and imaged at 60% epiboly. To quantify, images were overlaid with a grid and the number of squares containing at least one GFP+ cell was determined (e). (f) Quantification of the spread of transplanted wild-type donor cells along the AP axis of a wild-type or MZpitx2c mutant host embryo. Graphs indicate the average ± SEM. a-c: lateral views, anterior (A) to the left. a': dorsal view, anterior to the left. *p<0.05, ****p<0.0001 by unpaired t-test. Scale bars, 100 μm. |