
- Title
-
Loss of DNA methylation in zebrafish embryos activates retrotransposons to trigger antiviral signaling
- Authors
- Chernyavskaya, Y., Mudbhary, R., Tokarz, D., Jacob, V., Gopinath, S., Zhang, C., Sun, X., Wang, S., Magnani, E., Madakashira, B.P., Yoder, J.A., Hoshida, Y., Sadler, K.C.
- Source
- Full text @ Development

ZFIN is incorporating published figure images and captions as part of an ongoing project. Figures from some publications have not yet been curated, or are not available for display because of copyright restrictions. |
|
ZFIN is incorporating published figure images and captions as part of an ongoing project. Figures from some publications have not yet been curated, or are not available for display because of copyright restrictions. |
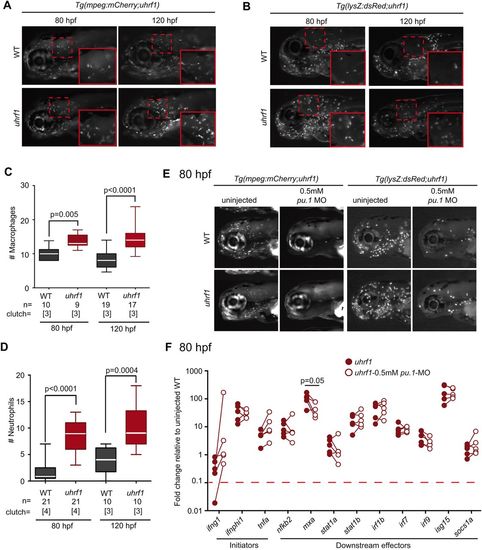
Leukocyte depletion does not reduce the induction of immune genes in uhrf1 mutants. Macrophages (A) and neutrophils (B) are enriched in the head (magnified in inset) of Tg(mpeg:mCherry;uhrf1) (A) and Tg(lysZ:dsRed;uhrf1) (B) and WT embryos at 80 and 120 hpf. Macrophages (C) and neutrophils (D) in the head region (inset in A,B) are significantly increased in uhrf1 mutants at 80 and 120 hpf. The number of embryos and clutches analyzed is indicated for each sample. (E) 0.5 mM pu.1 morpholino (MO) effectively reduces the leukocyte population. (F) RT-qPCR analysis reveals fold change in expression of immune genes from five clutches of uhrf1 and uhrf1 mutant/pu.1 morphants at 80 hpf (expression in WT embryos is shown in Fig. S5). A line connecting two dots represents one paired sample, which are siblings from a single clutch. P-values were determined by t-test (C,D) or paired t-test (F). EXPRESSION / LABELING:
PHENOTYPE:
|
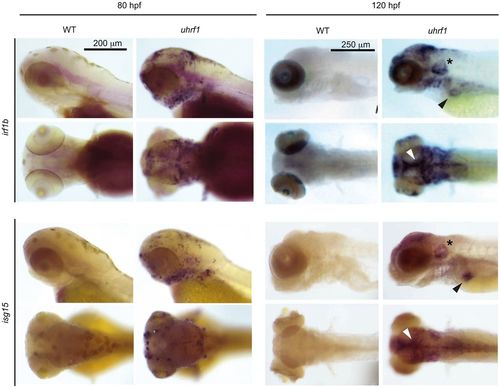
Interferon target genes are induced in the head, jaw and liver in uhrf1 mutants. ISH for irf1b and isg15, two of the most upregulated interferon genes, in 80 and 120 hpf uhrf1 and WT siblings (3-6 embryos per group/per time point). Staining is particularly intense along the caudomedial edge of the optic tectum (white arrowhead), ear (asterisk) and liver (black arrowhead) at 120 hpf for both genes. n=15, clutches=3. EXPRESSION / LABELING:
PHENOTYPE:
|
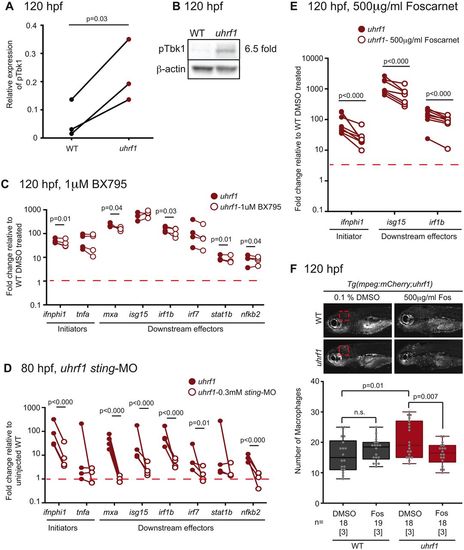
Cytosolic antiviral signaling is activated in uhrf1 mutants. (A) Change of pTbk1 protein levels quantified in three clutches of 120 hpf uhrf1 mutants and their siblings and (B) a representative western blot. (C) Embryos treated with 1 µM BX795 from 48-120 hpf were assayed for immune gene expression at 120 hpf by RT-qPCR in at least three clutches. Relative percentage change in gene expression is shown in treated uhrf1 compared with 0.1% DMSO-treated uhrf1 embryos (n=4). (D) Immune gene expression in uhrf1 mutant embryos injected with sting morpholino (MO) compared with uninjected uhrf1 mutants (n=4). (E) Examination of the expression of a limited panel of immune genes before and after 500 µg/µl Foscarnet (Fos) treatment in uhrf1 mutants (n=8). A line connecting two dots represents one paired sample of siblings from a single clutch. Significance was determined by t-test (A) or paired t-test (C-E). (F) Assessment of macrophage number in the head of embryos treated with 500 µg/µl Fos. The area quantified in WT and uhrf1 mutants is indicated (red dashed box). Error bars represent s.d. |
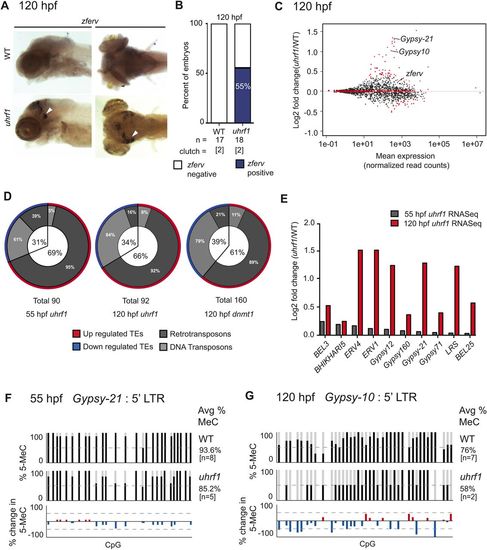
Endogenous retrotransposon expression is upregulated in uhrf1 mutants. (A) ISH of zferv expression in representative 120 hpf larvae. Staining is apparent in the eye and optic tectum (arrowheads). (B) ISH quantification of total number of embryos from two clutches scored for zferv expression in the head. (C) Expression of individual TEs, as normalized read counts, is plotted against log2 fold change of analogous TEs in uhrf1 relative to WT siblings as identified through RNA-seq. Red dots indicate TEs with significantly altered expression (P<0.05) and include the highly expressed Gypsy-10 and Gypsy-21. (D) TEs showing significant changes in C and two additional RNA-seq datasets from 55 hpf uhrf1 and 120 hpf dnmt1 mutants were grouped by expression and subdivided into transposon classes depending on their mechanism of mobility. (E) Expression comparison of select significantly induced TEs shared between 55 and 120 hpf uhrf1 mutant RNA-seq datasets. (F,G) Sanger sequencing of BS-PCR products from the Gypsy-21 (F) or Gypsy-10 (G) locus at 55 and 120 hpf in WT and uhrf1 mutants. Bottom panel shows differential methylation. |
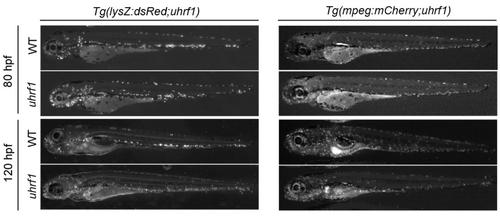
uhrf1 mutants show leukocyte expansion. Distribution of neutrophils and macrophages across whole embryos in uhrf1 and WT siblings at 80 and 120 hpf. |
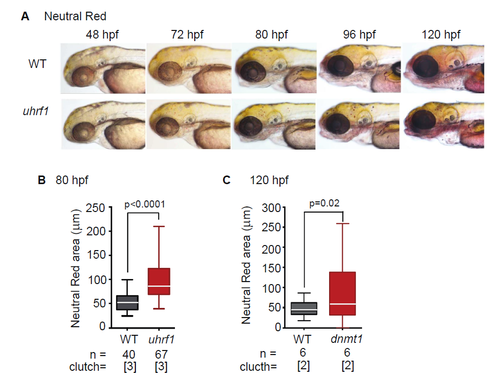
Neutral Red reveals macrophage enrichment in uhrf1 and dnmt1 mutants. (A) The presence of microglial macrophages in representative 48-120 hpf uhrf1 mutant and WT siblings as assessed by Neutral Red staining. (B) Quantification of area of Neutral Red spots in the heads of uhrf1 and WT embryos. Significance determined by ttest. |
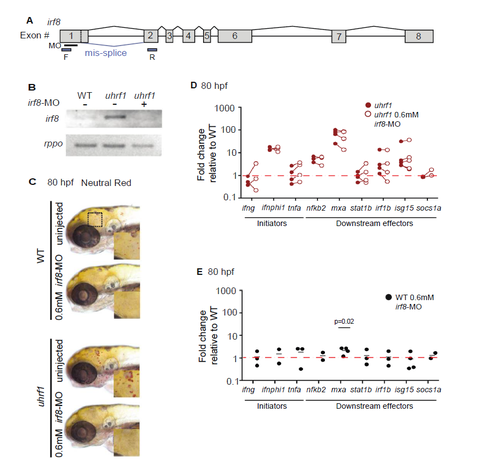
Macrophage depletion with irf8-MO does not rescue immune phenotype. (A) Exon map of irf8 transcript depicting the location of the splice-blocking morpholino (MO), binding site (black bar) and the primers used to validate its efficacy (blue boxes). (B) Loss of full-length irf8 transcript in uhrf1 mutants after irf8-MO knock down. (C) Embryos with or without 0.6 mM irf8-MO injection were assayed for presence of macrophages using Neutral Red (D) RT-qPCR for expression of interferon gene panel in uhrf1 and (E) WT siblings at 80 hpf. A line connecting two dots represents one paired sample with siblings from a single clutch. Significance determined by paired t-test. |