
- Title
-
PRC1 Stabilizes Cardiac Contraction by Regulating Cardiac Sarcomere Assembly and Cardiac Conduction System Construction
- Authors
- Peng, X., Feng, G., Zhang, Y., Sun, Y.
- Source
- Full text @ Int. J. Mol. Sci.
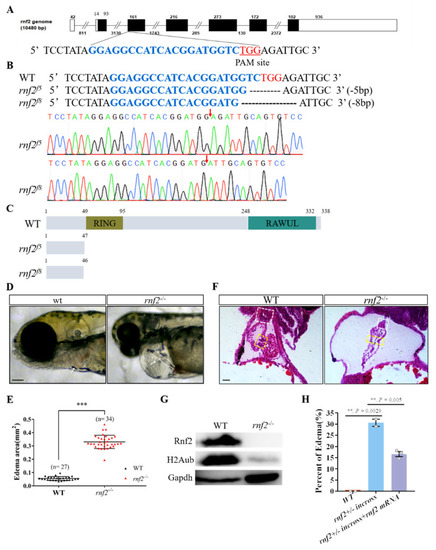
Rnf2-null zebrafish mutant displayed severe cardiac defects. (A) The target site (sequence highlighted in blue) is located in exon 3. The PAM site is underlined and highlighted in red; (B) DNA sequencing identified that two mutant alleles carried a 5 bp (rnf2f5) and 8 bp (rnf2f8) deletion respectively. The deletion sites are indicated by red arrows; (C) Schematic diagram of the wild-type and mutant Rnf2 proteins. Zebrafish wild-type Rnf2 contained an N-terminal Ring-finger domain (yellow) and a C-terminal RAWUL domain. The two mutant proteins were truncated before the RING-finger domain; (D) The rnf2−/− larvae displayed severe pericardia edema. The hearts are indicated by white arrows, the stringy heart in rnf2−/− is depicted by white dotted lines, scale bar: 0.2 mm; (E) Scatter plot showing the sectional area of edema in wild-type (black) and rnf2−/− (red). (F) Histological sections of 4 dpf heart, boxes in yellow indicate the AVC and valves, white boxes indicate the bulbous arteriosus, scale bar: 50 μm, n(WT) = 2, n (rnf2−/−) = 3; (G) Western blot verified the deletion of Rnf2 protein. Gapdh was set as internal reference; (H) Bar graph showing the percentage of embryos with edema. **, p < 0.01; ***, p < 0.001; n, sample number. EXPRESSION / LABELING:
PHENOTYPE:
|
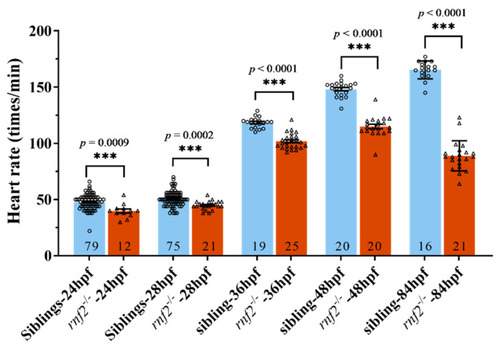
The cardiac contraction was disrupted in Rnf2-null zebrafish embryos. Scatter plot showing the heart rates of wild-type (blue) and rnf2−/− (red) embryos at different developmental stages. Numbers in the bottoms of the bars indicate the sample number of each group. ***, p < 0.001. PHENOTYPE:
|
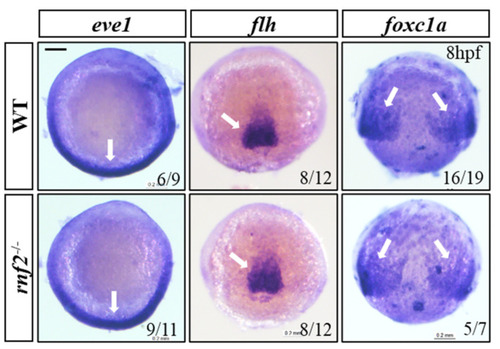
The mesoderm formed normally in Rnf2-null zebrafish embryos. WISH results showing expression of mesoderm markers eve1 (ventral mesoderm), flh (axial mesoderm), and foxc1a (paraxial mesoderm). The expression regions are indicated by white arrows. Scale bar: 0.2 mm. EXPRESSION / LABELING:
PHENOTYPE:
|

Expression of cardiomyocyte markers examined by in situ hybridization. (A) cmlc2 at different developmental stages; (B) Atrial (amhc) and ventricle (vmhc) cardiomyocyte markers at 24 hpf and 36 hpf; (C) Growth factor nppa at 24 hpf, 30 hpf, and 36 hpf; (D) tbx20 at 24 hpf; (E) Expression of endocardial precursor marker gene has2 and endothelial marker gene kdrl in the heart and blood vessels, white arrows indicate the heart tube; (F) Expression of endothelial marker gene cdh5 in the heart. The expression of genes in the heart is indicated by white arrows. Scale bar: 0.2 mm. EXPRESSION / LABELING:
PHENOTYPE:
|
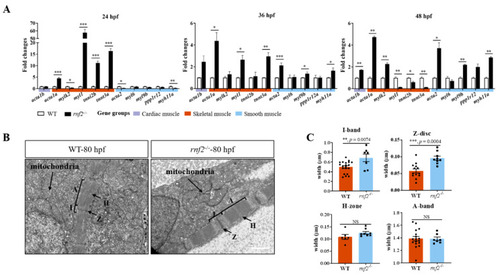
Rnf2 deficiency disorganized sarcomere assembly in zebrafish hearts. (A) Real-time PCR tested the expression of skeletal and smooth muscle genes at 36 hpf (left) and 48 hpf (right). The fold changes of relative mRNA levels are presented as mean ± SEM. The expression in wild-types was normalized to 1. The experiment was repeated on three separate occasions. n = 159, 111, and 161 for rnf2−/− group at 24 hpf, 36 hpf, and 48 hpf, respectively; n = 145, 113, and 164 for WT group at 24 hpf, 36 hpf, and 48 hpf, respectively. (B) Cardiac TEM revealed the sarcomere of cardiac muscle was abnormal in rnf2−/− hearts. A, A-band; I, I-band; H, H-zone; Z, Z-disc. Scale bar: 1.0 μm. n = 3. (C) Bar graph showing the width of A-band, I-band, Z-disc, and H-zone in wild-type and rnf2−/− cardiac sarcomeres. *, p < 0.05; **, p < 0.01; ***, p < 0.001; NS, no significant. PHENOTYPE:
|

Rnf2 deficiency caused defects in the cardiac conduction system. (A) Expression of AVC myocardial markers vcana and alcama; (B) Expression of AVC endocardial and SAN marker bmp4. Red arrows indicate AVC; (C) Fluo-4 staining detects calcium signal intensity in the hearts of rnf2−/− or wild-type embryos; V, ventricle; A, Atrium; #1/#2, sample number; n = 2. (D) Quantification of fluorescence intensity in Figure 6C. *, p < 0.05; Scale bar: 0.2 mm. |

Unillustrated author statements PHENOTYPE:
|