
- Title
-
Sequential regulation of hemogenic fate and hematopoietic stem and progenitor cell formation from arterial endothelium by Ezh1/2
- Authors
- Soto, R.A., Najia, M.A.T., Hachimi, M., Frame, J.M., Yette, G.A., Lummertz da Rocha, E., Stankunas, K., Daley, G.Q., North, T.E.
- Source
- Full text @ Stem Cell Reports
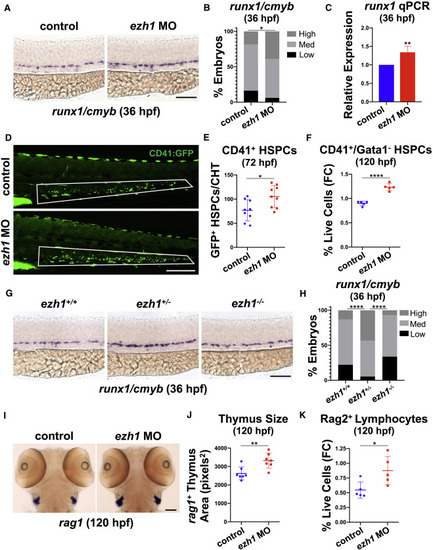
(A) WISH for runx1/cmyb in the DA of control and ezh1 morphants at 36 hpf. Scale bar, 100 μm. (B) Qualitative phenotypic distribution plot of embryos in (A) (n ≥ 49 embryos/condition; ∗p < 0.05). (C) Whole-embryo runx1 qPCR on control and ezh1 morphants at 36 hpf relative to 18s (n ≥ 25 embryos/sample × 4 replicate clutches; two-tailed unpaired Student's t test, ∗∗p < 0.01. Mean ± SEM). (D) In vivo imaging of CD41:GFP+ cells in the CHT at 72 hpf in control and ezh1 morphants. Scale bar, 200 μm. (E) Quantification of fluorescent images in (D) (n = 9 embryos/condition; two-tailed unpaired Student's t test, ∗p < 0.05. Error bars indicate SD). (F) Flow cytometry (FC) for CD41:GFP+/Gata1:dsRed− gated on percentage of live cells at 120 hpf in control and ezh1 morphants (n = 5 embryos/sample × 5 biological replicates; two-tailed unpaired Student's t test, ∗∗∗∗p < 0.0001. Error bars indicate SD). (G) WISH for runx1/cmyb in ezh1+/+, ezh1+/−, ezh1−/− embryos at 36 hpf. Scale bar, 100 μm. (H) Qualitative phenotypic distribution plot of embryos in (G) (n ≥ 74 embryos/genotype; ∗∗∗∗p < 0.0001). (I) WISH for rag1 expression in the thymus of control and ezh1 morphants at 120 hpf. Scale bar, 100 μm. (J) Quantification of thymic area in (I) (n = 7 embryos/condition; two-tailed unpaired Student's t test, ∗∗p < 0.01. Error bars indicate SD). (K) Flow cytometry (FC) for Rag2:GFP+ gated on percentage live cells at 120 hpf in control and ezh1 morphants (n = 5 embryos/sample × 5 biological replicates; two-tailed unpaired Student's t test, ∗p < 0.05. Error bars indicate SD). |
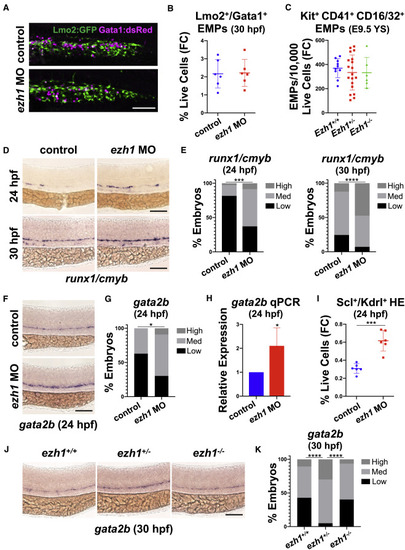
(A) Confocal imaging of Lmo2:GFP+/Gata1:dsRed+ in the PBI at 30 hpf in control and ezh1 morphants. Scale bar, 50 μm. (B) Flow cytometry (FC) for Lmo2:GFP+/Gata1:dsRed+ gated on percentage of live cells at 30 hpf in control and ezh1 morphants (n = 5 embryos/sample × 6 biological replicates; two-tailed unpaired Student's t test, not significant. Error bars indicate SD). (C) Flow cytometry (FC) for Kit+CD41+CD16/32+ gated on 10,000 live cells derived from E9.5 yolk sacs (YS) from Ezh1+/+, Ezh1+/−, Ezh1−/− mouse embryos (n ≥ 6 yolk sacs/genotype; one-way ANOVA, not significant. Error bars indicate SD). (D) WISH for runx1/cmyb at 24 and 30 hpf in control and ezh1 morphants. Scale bar, 100 μm. (E) Qualitative phenotypic distribution plot of embryos in (D) (n ≥ 60 embryos/condition; ∗∗∗p < 0.001, ∗∗∗∗p < 0.0001). (F) WISH for gata2b at 24 hpf in control and ezh1 morphants. Scale bar, 100 μm. (G) Qualitative phenotypic distribution plot of embryos in (F) (n = 35 control, 33 ezh1 morphants; ∗p < 0.05). (H) Whole-embryo gata2b qPCR on control and ezh1 morphants at 24 hpf relative to 18s (n ≥ 25 embryos/sample × 4 replicate clutches; two-tailed unpaired Student's t test, ∗p < 0.05. Mean ± SEM). (I) Flow cytometry (FC) on Scl:GFP+/Kdrl:mCherry+ gated on percentage of live cells at 24 hpf in control and ezh1 morphants (n = 5 embryos/sample × 6 biological replicates; two-tailed unpaired Student's t test, ∗∗∗p < 0.001. Error bars indicate SD). (J) WISH for gata2b in ezh1+/+, ezh1+/−, ezh1−/− embryos at 30 hpf. Scale bar, 100 μm. (K) Qualitative phenotypic distribution plot of embryos in (J) (n ≥ 40 embryos/genotype; ∗∗∗∗p < 0.0001). |
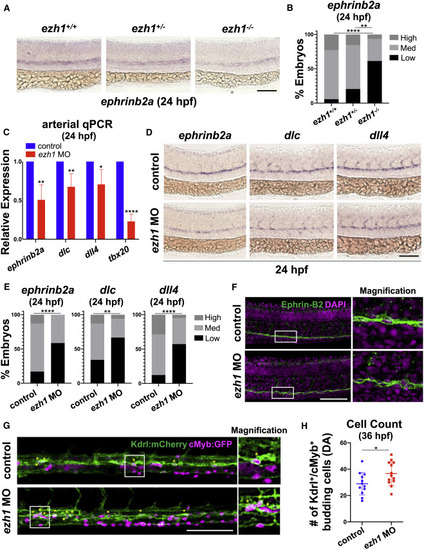
(A) WISH for ephrinb2a in ezh1+/+, ezh1+/−, ezh1−/− embryos at 24 hpf. Scale bar, 100 μm. (B) Qualitative phenotypic distribution plot of embryos in (A) (n ≥ 31 embryos/genotype; ∗∗p < 0.01, ∗∗∗∗p < 0.0001). (C) Whole-embryo ephrinb2a, dlc, dll4, and tbx20 qPCR on control and ezh1 morphants at 24 hpf relative to 18s (n ≥ 25 embryos/sample × 4 replicate clutches; two-tailed unpaired Student's t test, ∗∗p < 0.01, ∗p < 0.05, ∗∗∗∗p < 0.0001. Mean ± SEM). (D) WISH for arterial markers ephrinb2a, dlc, and dll4 in control and ezh1 morphants at 24 hpf. Scale bar, 100 μm. (E) Qualitative phenotypic distribution plot of embryos in (D) (n ≥ 42 embryos/condition; ∗∗p < 0.01, ∗∗∗∗p < 0.0001). (F) Confocal imaging of the DA from 24 hpf control and ezh1 morphant embryos. DAPI+ nuclei shown in magenta, Ephrin-B2+ cells shown in green. Scale bar, 100 μm. (G) Confocal imaging of Kdrl:mCherry+/cMyb:GFP+ budding HSPC cells in control and ezh1 morphants at 36 hpf in the DA. Scale bar, 100 μm. (H) Quantification of confocal images in (G) (n = 12 control, 13 ezh1 morphants; two-tailed unpaired Student's t test, ∗p < 0.05. Error bars indicate SD). |

(A) Sorted cell qPCR at 30 and 48 hpf for ezh1 and ezh2 expression on bulk Flk1−/Flt1− non-endothelial cells (NEC), Flk1+/Flt1− non-arterial endothelial cells (NAEC), Flk1+/Flt1+ arterial endothelium (AE), Gata2b+ hemogenic endothelial cells (HE), and Flk1+/cMyb+ hematopoietic stem and progenitor cells (HSPC). Reference gene: 18s (n ≥ 20 embryos/sample × ≥3 replicate clutches; two-way ANOVA, ∗∗p < 0.01, ∗∗∗∗p < 0.0001. Mean ± SEM). (B) Whole-embryo ezh2 qPCR on control and ezh1 morphants at 24 and 36 hpf relative to 18s (n ≥ 25 embryos/sample × 3 replicate clutches; two-tailed unpaired Student's t test, ∗p < 0.05. Mean ± SEM). (C) In vivo imaging of CD41:GFP+ cells in the CHT in control and ezh1 morphants ± dimethyl sulfoxide (DMSO)/1 μM GSK126 treatment from 12 to 72 hpf. Scale bar, 200 μm. (D) Quantification of fluorescent images in (C) (n = 7 embryos/condition; one-way ANOVA, ∗p < 0.05, ∗∗∗∗p < 0.0001. Error bars indicate SD). (E) Whole-embryo ephrinb2a, dll4, dlc, and tbx20 qPCR on DMSO and 1 μM GSK126-treated embryos from 12 to 24 hpf relative to 18s (n ≥ 25 embryos/sample × ≥3 replicate clutches; two-tailed unpaired Student's t test, ∗∗∗∗p < 0.0001. Mean ± SEM). (F) Whole-embryo ephrinb2a, dll4, dlc, and tbx20 qPCR on control and ezh2 mRNA-injected embryos at 24 hpf relative to 18s (n ≥ 25 embryos/sample × 3 replicate clutches; two-tailed unpaired Student's t test, not significant. Mean ± SEM). (G) WISH for gata2b on DMSO and 1 μM GSK126-treated embryos from 12 to 30 hpf. Scale bar, 100 μm. (H) Qualitative phenotypic distribution plot of embryos in (G) (n = 33 DMSO, 38 GSK126-treated embryos). (I) Whole-embryo gata2b qPCR on DMSO and 1 μM GSK126-treated embryos from 12 to 24 hpf relative to 18s (n ≥ 25 embryos/sample × 4 replicate clutches; two-tailed unpaired Student's t test, not significant. Mean ± SEM). EXPRESSION / LABELING:
PHENOTYPE:
|
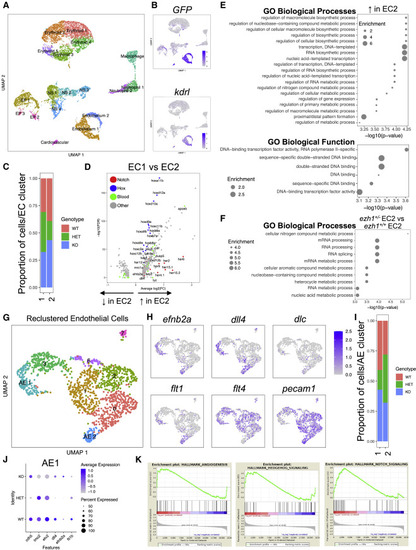
(A) UMAP plot and cell-clustering analysis, with 18 distinct clusters identified. NS, nervous system; EP, epithelium. (B) UMAP plots showing GFP and kdrl expression across sorted cell types. (C) Proportion of ezh1+/+ (WT), ezh1+/− (HET), and ezh1−/− (KO) cells in EC1 and EC2. (D) Volcano plot displaying the pattern of gene expression values for EC2 relative to EC1. Selected genes are indicated based on significance. (E) GO enrichment for Biological Process (upper) and Functions (lower) associated with upregulated genes in EC2. (F) GO enrichment analysis for ezh1+/− EC2 versus ezh1+/+ EC2 sorted endothelial cells. (G) UMAP plot and reclustering analysis on EC clusters, with eight distinct clusters identified. AE, arterial endothelium. (H) UMAP plots showing localization of arterial markers efnb2a, dll4, dlc, and flt1, as well as the venous marker flt4 and pan-endothelial marker pecam1 in AE1 and AE2. (I) Proportion of ezh1+/+, ezh1+/−, and ezh1−/− cells in AE1 and AE2. (J) Dot plot of differentially expressed vascular genes for each genotype. (K) GSEA of day 28 CD34+CD38− HSPCs 5F plus shEZH1 compared with 5F plus shLUC cells from Vo et al., 2018 (n = 10 shEZH1, 8 shLUC samples). |
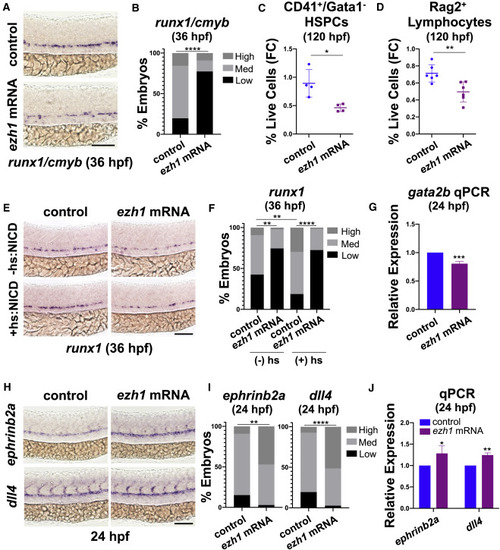
(A) WISH for runx1/cmyb at 36 hpf in control and ezh1 mRNA-injected embryos. Scale bar, 100 μm. (B) Qualitative phenotypic distribution plot of embryos in (A) (n = 51 control, 44 ezh1 mRNA-injected embryos; ∗∗∗∗p < 0.0001). (C) Flow cytometry (FC) on CD41:GFP+/Gata1:dsRed− gated on percentage of live cells at 120 hpf in control and ezh1 mRNA-injected embryos (n = 5 embryos/sample × 4 biological replicates; two-tailed unpaired Student's t test, ∗p < 0.05. Error bars indicate SD). (D) Flow cytometry (FC) for Rag2:GFP+ gated on percentage of live cells at 120 hpf in control and ezh1 mRNA-injected embryos (n = 5 embryos/sample × 6 biological replicates; two-tailed unpaired Student's t test, ∗∗p < 0.01. Error bars indicate SD). (E) WISH for runx1 at 36 hpf in control and ezh1 mRNA-injected Hsp70:NICD embryos ± heat shock at 30 hpf. Scale bar, 100 μm. (F) Qualitative phenotypic distribution plot of embryos in (E) (n ≥ 47 embryos/condition; ∗∗p < 0.01, ∗∗∗∗p < 0.0001). (G) Whole-embryo gata2b qPCR on control and ezh1 mRNA-injected embryos at 24 hpf relative to 18s (n ≥ 25 embryos/sample × 3 replicate clutches; two-tailed unpaired Student's t test, ∗∗∗p < 0.001. Mean ± SEM). (H) WISH for ephrinb2a and dll4 at 24 hpf in control and ezh1 mRNA-injected embryos. Scale bar, 100 μm. (I) Qualitative phenotypic distribution plot of embryos in (H) (n ≥ 33 embryos/condition; ∗∗p < 0.01, ∗∗∗∗p < 0.0001). (J) Whole-embryo ephrinb2a and dll4 qPCR on control and ezh1 mRNA-injected embryos at 24 hpf relative to 18s (n ≥ 25 embryos/sample × 3 replicate clutches; two-tailed unpaired Student's t test, ∗p < 0.05, ∗∗p < 0.01. Mean ± SEM). |