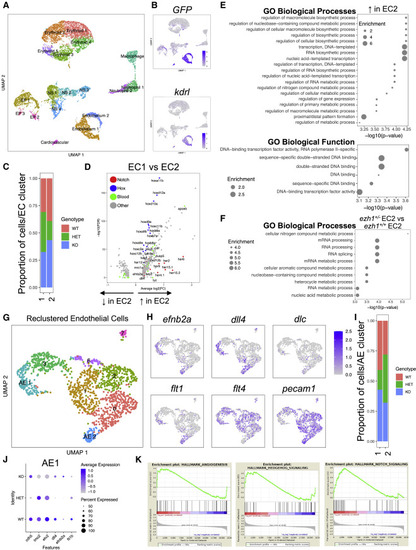
(A) UMAP plot and cell-clustering analysis, with 18 distinct clusters identified. NS, nervous system; EP, epithelium. (B) UMAP plots showing GFP and kdrl expression across sorted cell types. (C) Proportion of ezh1+/+ (WT), ezh1+/− (HET), and ezh1−/− (KO) cells in EC1 and EC2. (D) Volcano plot displaying the pattern of gene expression values for EC2 relative to EC1. Selected genes are indicated based on significance. (E) GO enrichment for Biological Process (upper) and Functions (lower) associated with upregulated genes in EC2. (F) GO enrichment analysis for ezh1+/− EC2 versus ezh1+/+ EC2 sorted endothelial cells. (G) UMAP plot and reclustering analysis on EC clusters, with eight distinct clusters identified. AE, arterial endothelium. (H) UMAP plots showing localization of arterial markers efnb2a, dll4, dlc, and flt1, as well as the venous marker flt4 and pan-endothelial marker pecam1 in AE1 and AE2. (I) Proportion of ezh1+/+, ezh1+/−, and ezh1−/− cells in AE1 and AE2. (J) Dot plot of differentially expressed vascular genes for each genotype. (K) GSEA of day 28 CD34+CD38− HSPCs 5F plus shEZH1 compared with 5F plus shLUC cells from Vo et al., 2018 (n = 10 shEZH1, 8 shLUC samples).
|
