
- Title
-
Deficiency in class III PI3-kinase confers postnatal lethality with IBD-like features in zebrafish
- Authors
- Zhao, S., Xia, J., Wu, X., Zhang, L., Wang, P., Wang, H., Li, H., Wang, X., Chen, Y., Agnetti, J., Li, Y., Pei, D., Shu, X.
- Source
- Full text @ Nat. Commun.
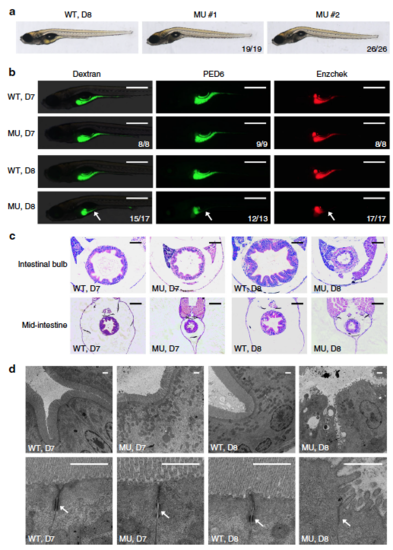
Intestinal defects in pik3c3 mutants. a General morphology of WT and pik3c3 mutants at 8 dpf. b In vivo imaging of zebrafish digestive organ with fluorescent reporters. FITC-labeled dextran is used to evaluate the nutrient uptake activity and the quenched fluorescent reporter PED6 or Enzchek is activated only after cleavage by intestinal phospholipase or protease. The digestive functions appear normal in mutants at 7 dpf while they become defective at 8 dpf. Scale bars, 500 µm. Numbers in (a, b) represent (embryos with the indicated phenotype)/(total embryos analyzed). c Hematoxylin–eosin staining of cross sections corresponding to the intestinal bulb or mid-intestine of embryos at 7–8 dpf. Typical intestinal folding is lost and cell shedding can be detected in pik3c3 mutants at 8 dpf. Scale bars, 50 µm. d TEM analyses of IECs. Adherens junctions (arrow) are defective in mutants. Microvilli and cell junctions are severely disrupted in mutants at 8 dpf. Scale bars, 1 µm |

Defective gene expressions in pik3c3 mutants. a RNA-Seq analysis of pik3c3 mutants and control siblings at 6–8 dpf. Representative heatmaps show the expression of genes in one of these categories: extracellular matrix-related genes, liver and gut metabolic genes or markers of endoderm-derived cell lineages. b qRT-PCR analysis of the indicated genes from whole embryonic extracts. apoa1a is an apolipoprotein family member expressed in liver, gut, and other tissues. fabp2 is intestinal fatty acid-binding protein. villin 1 (vil1) and slc15a1b (pept1) are markers of intestinal epithelium. fabp10a is liver fatty acid-binding protein. trypsin (try) and insulin (ins) are markers of exocrine and endocrine pancreas, respectively. gapdh is the internal control and data represent mean ± SD from three independent biological repeats (NS, non-significant; *p < 0.05; **p < 0.01; ****p < 0.0001 in one-way ANOVA with Tukey’s multiple comparison). c In situ hybridization of 8 dpf embryos with the indicated probes. Red arrows point to intestines and black arrows indicate pancreases. Numbers represent (embryos with the indicated phenotype)/(total embryos analyzed) |
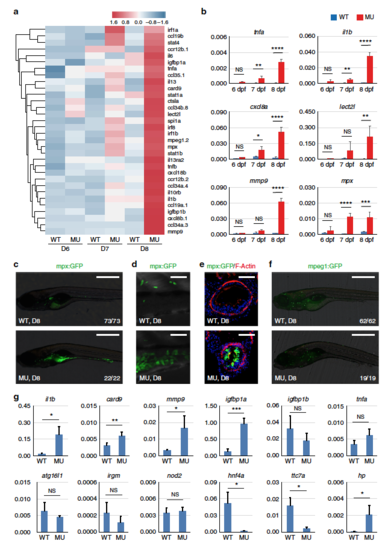
Pro-inflammatory responses in the intestine of pik3c3 mutants. a Heatmap of inflammation-related genes shows the gradual stimulation of inflammatory response from 6 to 8 dpf in the mutants. b qRT-PCR analysis of the indicated inflammation-related genes. cxcl8a is the zebrafish homolog of IL8. Experiments were performed and data analyzed as described in Fig. 2b. c mpx:GFP is a transgenic zebrafish line with neutrophils labeled by GFP. In 8 dpf mutants, neutrophils mainly accumulate in the digestive tract. Scale bar, 500 µm. d High magnification confocal imaging of (c). Scale bar, 50 µm. e Cross sections of intestinal bulb in D8 embryos. Neutrophil infiltration of intestinal epithelium is clearly seen in the mutants. Scale bar, 50 µm. f mpeg1:GFP-labeled macrophage lineage cells appear normal in the mutants. Scale bar, 500 µm. g qRT-PCR analysis of the expression of IBD candidate genes in dissected intestine of pik3c3 mutants at 8 dpf. Inflammatory response genes (il1b, card9, mmp9) and igfbp1a (one of the homologs of human IGFBP1, a gene related to the prognosis of CD) are significantly up-regulated in the mutants. Bacteria sensing and autophagy-related genes (nod2, atg16l1, and irgm) and tnfa are not stimulated. Barrier function-related genes hnf4a and ttc7a are severely down-regulated in the mutants while the hp gene, which functions to open up tight junctions, is up-regulated in the mutants. actb1 is used as internal control and data represent mean ± SD from three biological repeats. p-values are determined by unpaired two-tailed Student’s t-test (NS, non-significant; *p < 0.05; **p < 0.01; ***p < 0.001; ****p < 0.0001) |
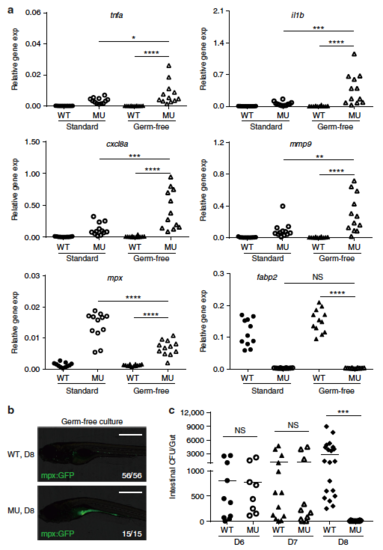
Intestinal microorganisms are not required for PIK3C3 deficiency-induced inflammation. a Scatter plots showing the qRT-PCR results of the indicated genes in 8 dpf embryos under either standard or germ-free culture conditions. Each dot represents the mean of three technical replicates from one embryo. Inflammatory genes are significantly stimulated in mutants under germ-free culture condition. NS, non-significant; *p < 0.05; **p < 0.01; ***p < 0.001; ****p < 0.0001 in one-way ANOVA with Tukey’s multiple comparison. b Neutrophils accumulate in the digestive tract of mutant in the absence of gut microbiota. Images were acquired as described in Fig. 3c. c Scatter plot showing the numbers of bacteria in intestinal homogenates from individual embryo at 6, 7, and 8 dpf under standard culture condition. WT and mutants have similar gut bacteria at 6 and 7 dpf. However, the number of gut bacteria becomes either very low (<20 CFU/gut, 5 out of 14 embryos) or undetectable (9 out of 14) in the mutants at 8 dpf, which is significantly reduced when compared to that in wild type siblings (NS, non-significant; ***p < 0.001 in one-way ANOVA with Tukey’s multiple comparison) |
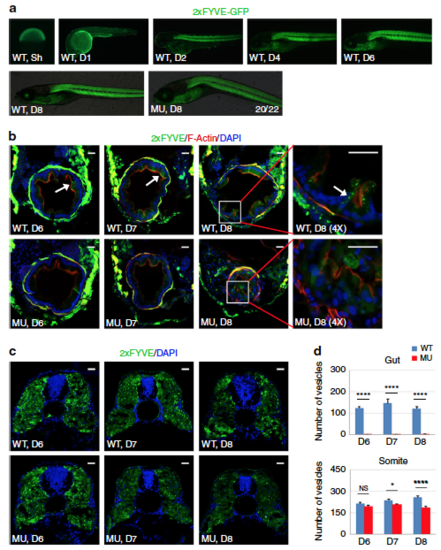
PI3P-positive vesicles are reduced in mutant IECs. a Represent images of transgenic zebrafish expressing the PI3P probe 2xFYVE-GFP under the control of ubiquitin promoter. Sh shield stage. b Cross sections of embryos at 6–8 dpf. PI3P-positive vesicles (arrow) are detectable in WT IECs, while the GFP signal in mutant IECs is weak and diffused. Scale bar, 20 µm. c PI3P-positive vesicles in somitic corss sections. Scale bar, 20 µm. d Quantification of PI3P-positive vesicles in (b, c). Data represent mean ± SD from three biological repeats (NS, non-significant; *p < 0.05; ****p < 0.0001 in one-way ANOVA with Tukey’s multiple comparison) |

PIK3C3 deficiency induces polarity defects in IECs. a Immunofluorescence staining of gut cross sections at 8 dpf. In WT embryos, columnar IECs are arranged into a sheet and E-Cadherin are laterally distributed. IECs become disorganized and E-Cadherin is endocytosed and forms intracellular aggregates in the mutants. LAMP1 is a lysosome marker and it does not co-localize with E-Cadherin aggregates. Other polarity-related proteins including Na,K-ATPase alpha 1 subunit (ATP1A1) and tight junction protein ZO-1 also lose their polarized distributions in the mutant guts. Scale bar, 20 µm. b Western blot analysis for the expression levels of E-Cadherin and ZO-1 in the dissected digestive tracts from 8 dpf embryos. Beta actin is the loading control. c qRT-PCR analysis of cdh1 and zo-1. Assays are performed as described in Fig. 3f. d Knockdown efficiency of PIK3C3 by siRNA in Caco2 cells as determined by qRT-PCR. ACTB is the internal control and data represent mean ± SD from three biological repeats (***p < 0.001 by unpaired two-tailed Student’s t-test). e PIK3C3 knockdown induces internalization of E-Cadherin in Caco2 cyst cultured on 3D Matrigel. Scale bar, 10 µm. f Quantification of (e). In each experiment, about 100 cysts were analyzed and data represent mean ± SD of the percentages of cyst with internalized E-Cadherin from three biological repeats (**p < 0.01 by unpaired two-tailed Student’s t-test). g Western blot analysis of E-Cadherin protein levels in control or siPIK3C3-treated Caco2 cells. Beta actin is the loading control |
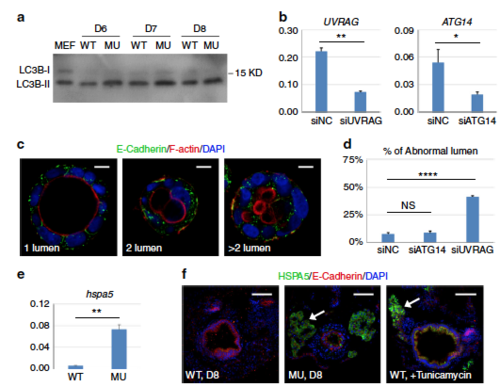
Defects in endocytic trafficking is responsible for PIK3C3 deficiency-induced polarity defect. a Western blot analysis of LC3B in dissected gut. MEF lysate (total cell lysate of mouse embryonic fibroblasts under autophagic conditions) was used as the positive control. The LC3B antibody can detect the activated form of zebrafish LC3B (LC3B-II) but not LC3B-I. b qRT-PCR analysis for the efficiency of siRNA to UVRAG or ATG14 in Caco2 cells. ACTB is the internal control and data represent mean ± SD from three biological repeats (*p < 0.05; **p < 0.01 by unpaired two-tailed Student’s t-test). c, d UVRAG but not ATG14 knockdown induces abnormal lumen formation and E-Cadherin mis-localization in Caco2 cyst. Scale bar, 10 µm. Data represent mean ± SD of the percentages of abnormal cyst (two or multiple lumens) from three biological repeats. NS, non-significant; ****p < 0.0001 by one-way ANOVA with Dunnett’s multiple comparison. e qRT-PCR analysis of ER stress gene hspa5 (heat shock protein family A member 5) in 8 dpf embryos. gapdh is the internal control and data represent mean ± SD from three independent repeats. p-value determined by unpaired two-tailed Student’s t-test (**p < 0.01). f Immunofluorescence staining of gut cross sections. In the pik3c3 mutant, HSPA5 signal is detected in liver (arrow) and a few cells in gut. Treatment of WT embryos with tunicamycin (an ER stress inducer, 1 µM from 7 to 8 dpf) strongly induces HSPA5 in liver and gut. Scale bar, 50 µm |
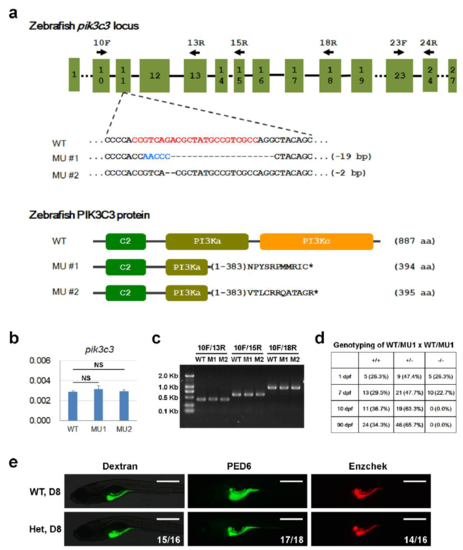
PIK3C3 knockout in zebrafish. (a) Crispr/Cas9 mediated knockout of pik3c3. gRNA targeting sequence in exon 11 is highlighted in red. We recovered two stably transmitted mutant alleles and they are predicted to produce truncated proteins of 394 and 395 aa respectively. (b) qPCR analysis with primers 23F/24R reveals that WT and mutant RNAs are expressed at similar levels. gapdh is the internal control and data represent mean±SD from three independent repeats. NS, non-significant in one-way ANOVA with Dunnett's Multiple Comparison. (c) RT-PCR with the indicated primer pairs generate only one band in each mutant, indicating mutant RNAs are spliced normally. (d) Genotyping results of WT, heterozygote and mutant at the indicated stages. (e) The digestive activities in heterozygous embryos are normal at 8 dpf as revealed by Dextran, PED6 and Enzchek staining. Assays were performed as described in fig.1b. |
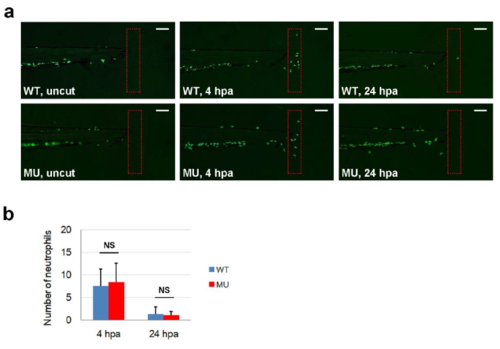
Migration of mpx-GFP cells after tailfin amputation in control sibling and pik3c3 mutant embryos. (a) Representative distributions of mpx-GFP cells in uncut, 4 or 24 hrs post amputation (hpa) embryos. Scale bars, 100 µm. (b) Average numbers of mpx-GFP cells in the outlined tail regions in (a). Data represent mean±Sd of 17 (for WT) or 13 (for MU) embryos. p-value calculated by one-way ANOVA with Tukey's Multiple Comparison (NS, non-significant). |