
- Title
-
Zebrafish IGF genes: gene duplication, conservation and divergence, and novel roles in midline and notochord development
- Authors
- Zou, S., Kamei, H., Modi, Z., and Duan, C.
- Source
- Full text @ PLoS One
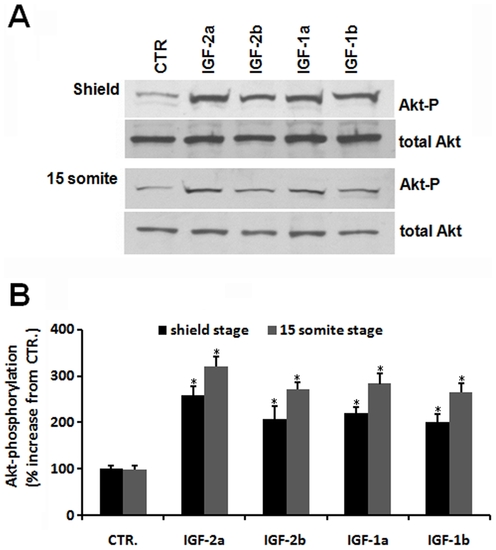
All four zebrafish igf genes are functional. (A) Microinjection of each of the 4 zebrafish IGF mRNA into zebrafish embryo resulted in elevated Akt phospholylation. GFP, IGF-1a, -1b, -2a, and -2b mRNA was injected into zebrafish embryos at 1-2 cell stage. The injected embryos were raised to shield and 15 somite stages. Lysates were prepared and subjected to SDS-PAGE followed by immunoblot analysis using antibodies against total and phosphorylated Akt (Akt-P). (B) Densitometric analysis result of (A). The phosphorylated Akt/total Akt ratio was calculated and expressed as % of the control (GFP mRNA injected) group. Grey bars represent the shield stage groups, and dark bars represent the 15 somite stage groups. Values are means±SE (n = 3). *p<0.01 compared with the control group. |
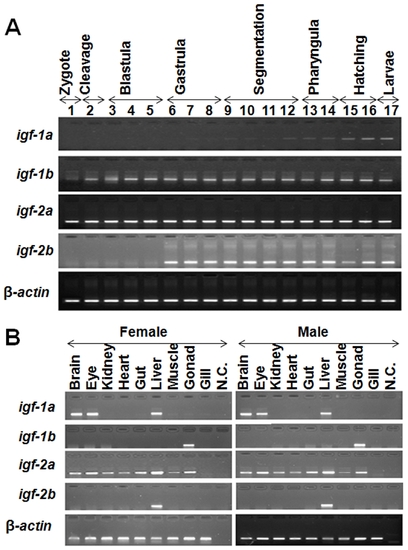
Temporal and spatial expression patterns of the duplicated zebrafish IGF genes. (A) RT-PCR analysis of IGF mRNAs in zebrafish embryos at the indicated stages. Numbers are the different embryo developmental stages (1, 1–2 cell; 2, 32-cell; 3, 512-cell; 4, oblong; 5, 30%-epiboly; 6, 50%-epiboly; 7, 90%-epiboly; 8, tailbud; 9, 2-somite; 10, 12-somite; 11, 18-somite; 12, 24–26 somite; 13, Prim-6; 14, Prim-22; 15, 48hpf; 16, 72hpf; 17, 96hpf). (B) RT-PCR analysis of IGF mRNAs in female and male adult zebrafish tissues. |
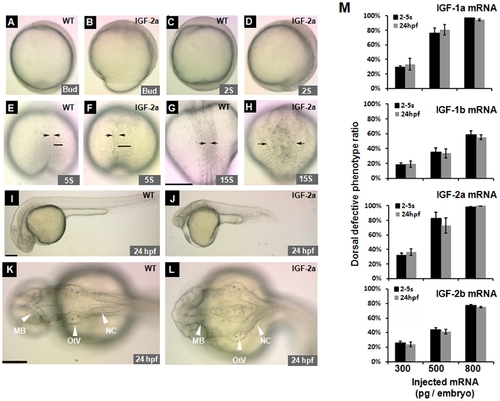
Effect of forced IGF expression in zebrafish embryos. (A, B) Lateral view of a GFP mRNA injected control embryo (A) and an IGF-2a mRNA injected embryo (B) at the bud stage. Note the delayed mesoderm involution associated with an open blastopore (>75%, n = 328) in the IGF-2a mRNA injected embryos (B). (C, D) Lateral views of a control embryo (C) or an IGF-2a mRNA injected embryo (D) at 2-somite stage. Note the shortened A-P axis and more posterior tissues in (D). (E–H) Dorsal view of a control (E, G) or an IGF-2a mRNA injected embryo (F, H) at the 5-somite (E and F) and 15-somite stages (G and H). All embryos are dorsal views with head up. Arrows indicate the width of the notochord. Black bars in panels E and F show the width of the somite. Scale bar = 200 μm. (I–L) Morphology of a GFP mRNA injected control embryo (I and K) and an IGF-2a mRNA injected embryo (J and L) at 24 hpf. I and J are lateral views with head to the left and K and L are dorsal views with head to the left. MB, mid brain; OtV, otic vesicle; NC, notochord. Scale bar = 200 μm. (M) Dose-dependent effects of various IGFs in zebrafish embryos. The results are means of 3–4 independent experiments. |
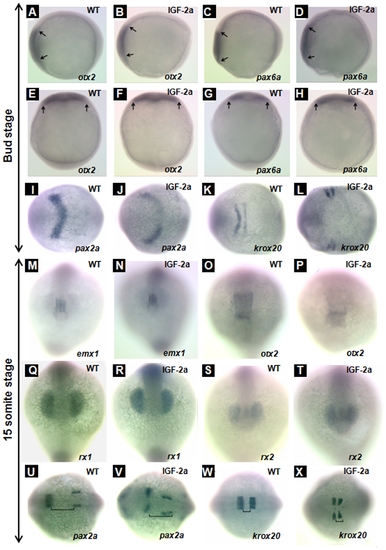
Effect of IGF-2a expression. otx2 expression in the anterior neural plate at the bud stage in a control embryo (panels A and E) and an IGF-2a mRNA injected embryo (panels B and F). pax6a expression in the anterior neural plate at the bud stage in a control embryo (panels C and G) and an IGF-2a mRNA injected embryo (panels D and H). pax2a expression in the midbrain hindbrain boundary at the bud stage in a control embryo (panel I) and an IGF-2a mRNA injected embryo (panel J). krox20 expression in the rhombomere 3 and 5 at the bud stage in a control embryo (panel K) and an IGF-2a mRNA injected embryo (panel L). emx1 expression in the forebrain at the 15-somite stage in a control embryo (panel M) and an IGF-2a mRNA injected embryo (panel N). otx2 expression in the midbrain at the 15-somite stage in a control embryo (panel O) and an IGF-2a mRNA injected embryo (panel P). rx1 expression in the optic vesicle at the 15-somite stage in a control embryo (panel Q) and an IGF-2a mRNA injected embryo (panel R). rx2 expression in the optic vesicle at the 15-somite stage in a control embryo (panel S) and an IGF-2a mRNA injected embryo (panel T). pax2a expression in the midbrain hindbrain boundary at the 15-somite stage in a control embryo (panel U) and an IGF-2a mRNA injected embryo (panel V). krox20 expression in the rhombomere 3 and 5 at the 15-somite stage in a control embryo (panel W) and a 500 pg IGF-2a mRNA injected embryo (panel X). Panels A–D, lateral view, head left; panels E–H, dorsal view, head up; panels I–L and U–X, dorsal view, head left; panels M–T, front view. Black line in panels U, V indicates the gap between the midbrain hindbrain boundary and otic vesicle; black line in panels W, X indicates the gap between rhombomere 3 and 5. EXPRESSION / LABELING:
|
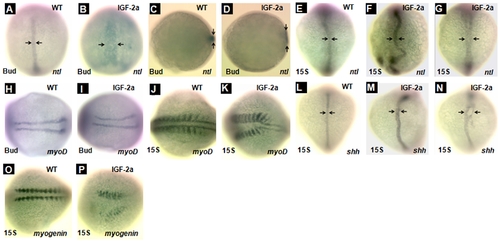
Overexpression of IGF-2a results in abnormal notochord development. ntl expression in the notochord at the bud stage in a control embryo (panels A and C) and an IGF-2a mRNA injected embryo (panels B and D). ntl expression in the notochord at the 15-somite stage in a control embryo (panel E) and IGF-2a mRNA injected embryos (panels F and G). Among the IGF-2a mRNA injected embryos, 65% showed the expression pattern shown in panel F and 35% showed that in panel G (n = 17). myoD expression in the somite at the bud stage in a control embryo (panel H) and an IGF-2a mRNA injected embryo (panel I). myoD expression in the somite at the 15-somite stage in a control embryo (panel J) and an IGF-2a mRNA injected embryo (panel K). shh expression in the notochord at the 15-somite stage in a control embryo (panel L) and IGF-2a mRNA injected embryos (panels M and N). Among the IGF-2a mRNA injected embryos, 71% showed expression pattern shown in panel M and 24% showed that in panel N (n = 21). myogenin expression in the somite at the 15-somite stage in a control embryo (panel O) and an IGF-2a mRNA injected embryo (panel P). Panels A, B, E–G, and L–N are dorsal view with head up; panels C and D are vegetal view with dorsal the the right; panels H–K, O, and P are dorsal views with head to the left. EXPRESSION / LABELING:
|