
|
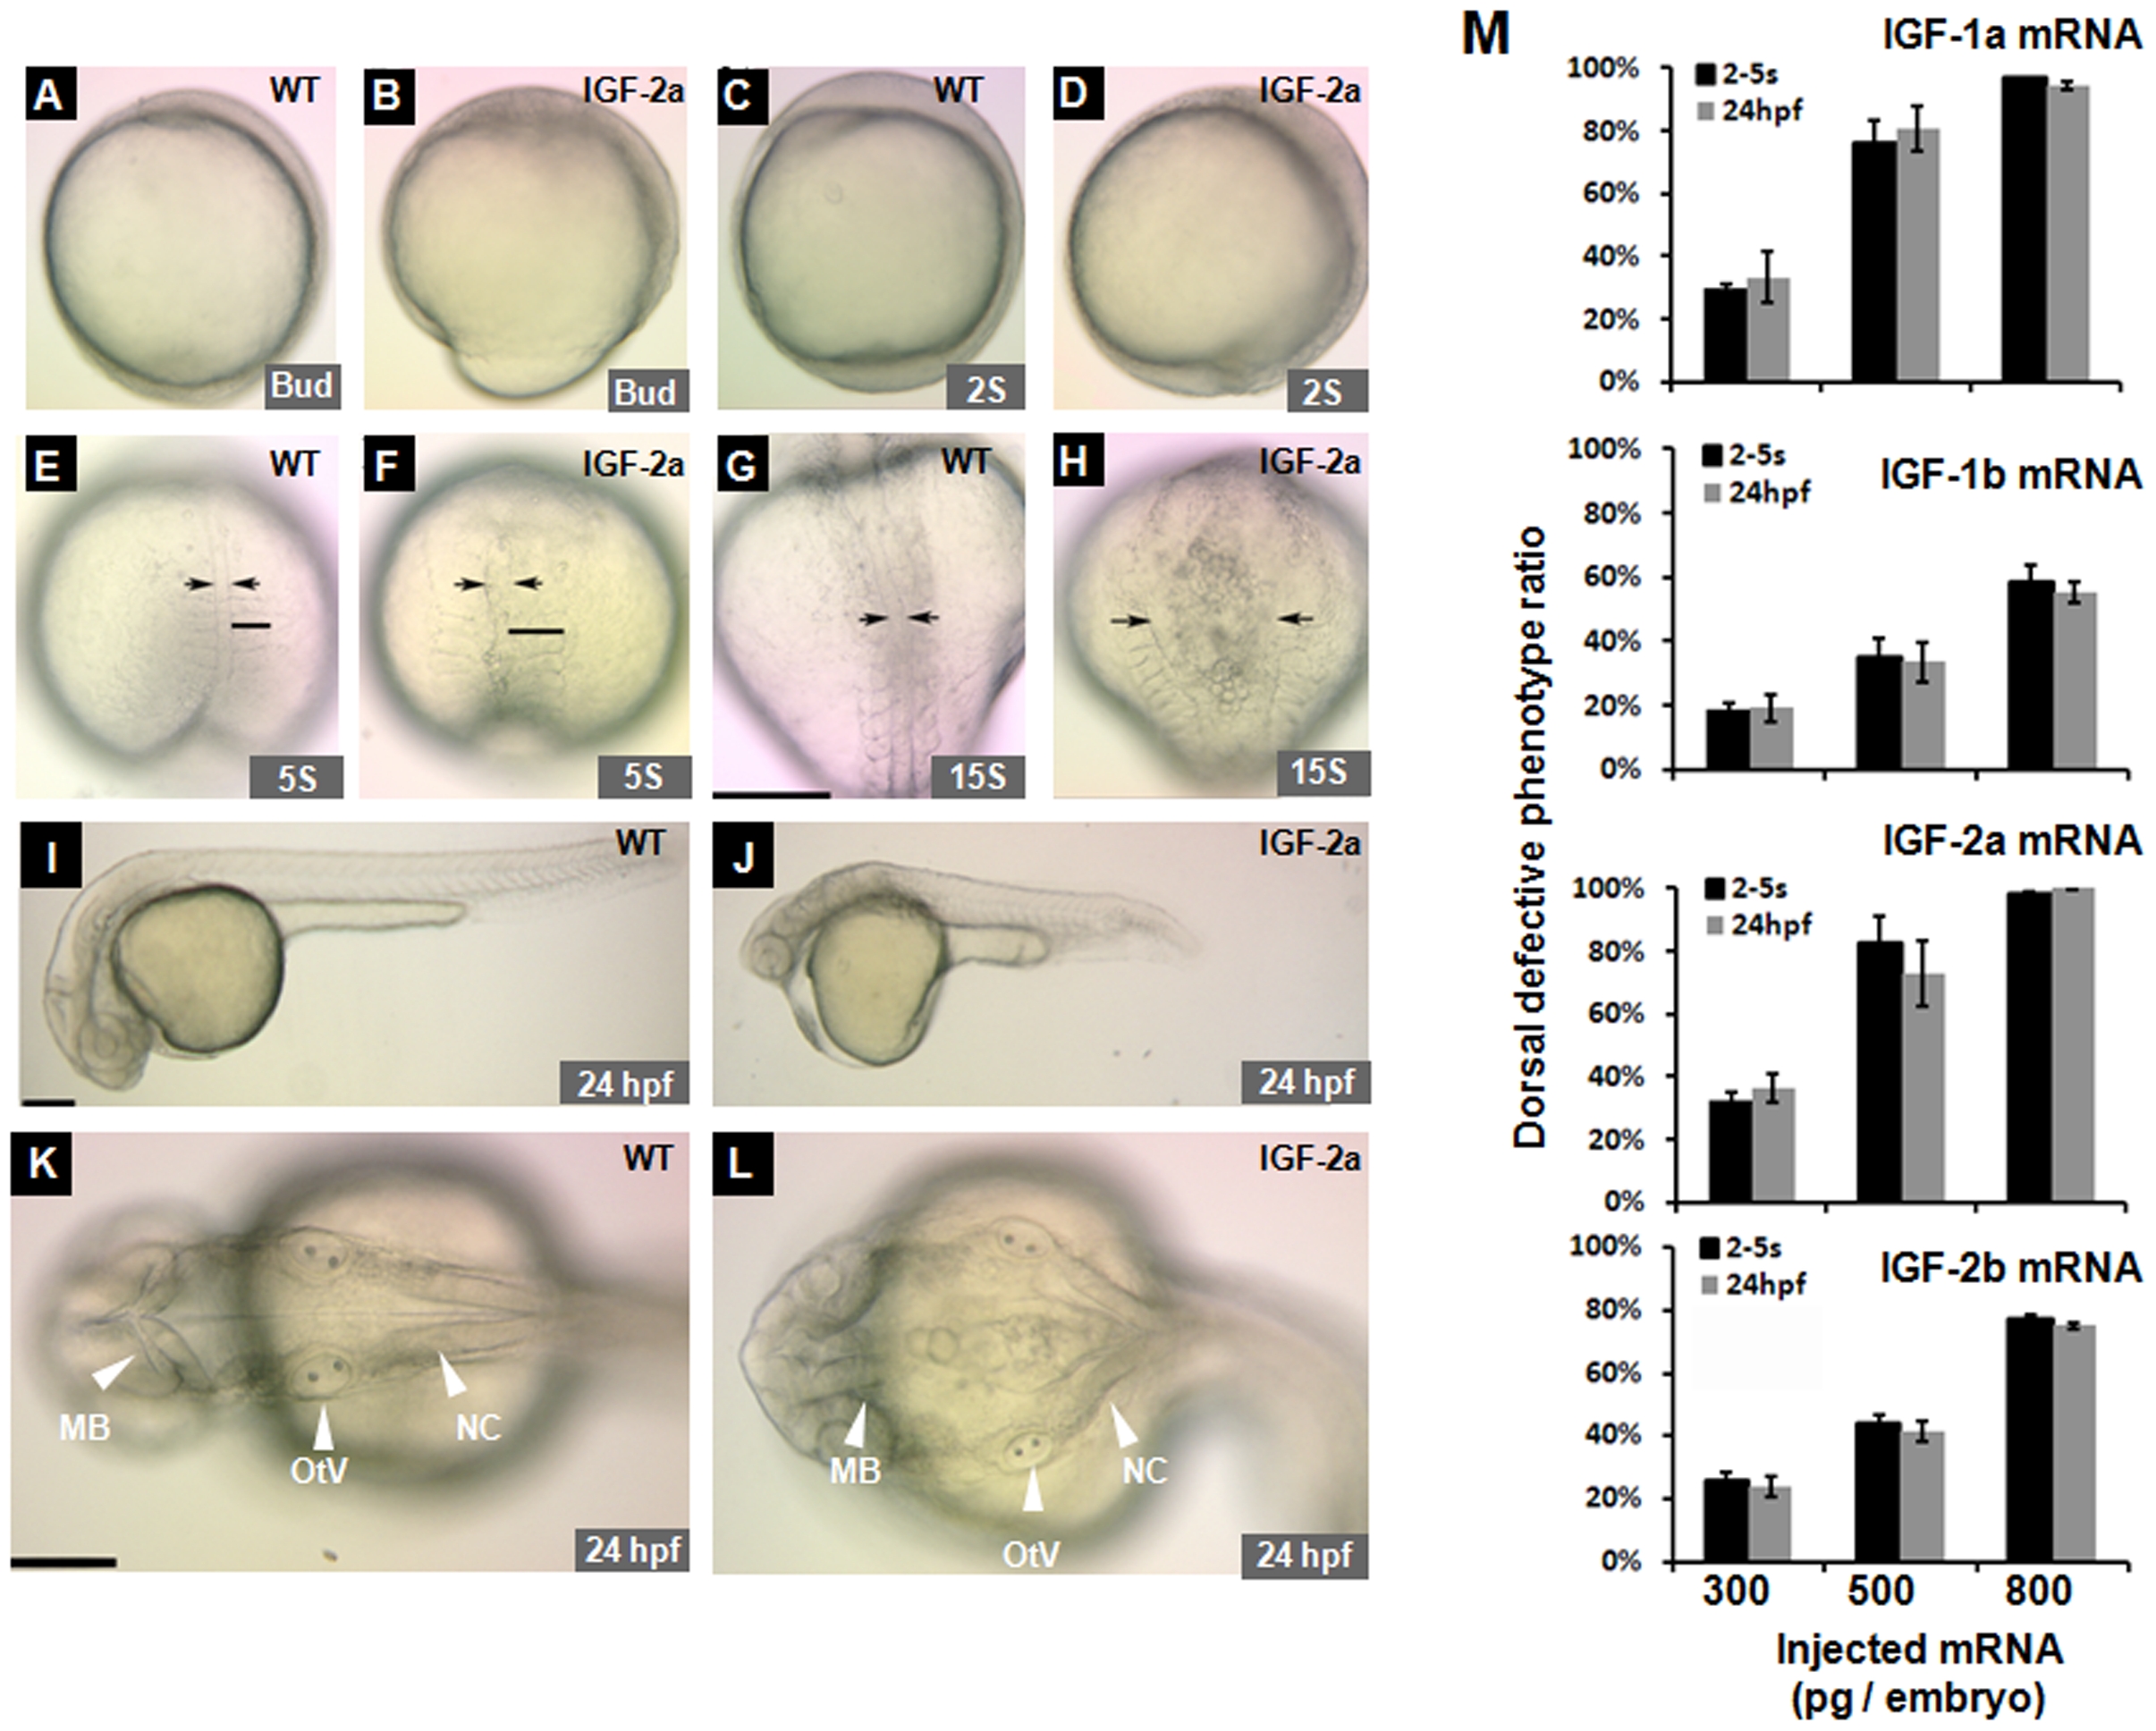
Fig. 5 Effect of forced IGF expression in zebrafish embryos.
(A, B) Lateral view of a GFP mRNA injected control embryo (A) and an IGF-2a mRNA injected embryo (B) at the bud stage. Note the delayed mesoderm involution associated with an open blastopore (>75%, n = 328) in the IGF-2a mRNA injected embryos (B). (C, D) Lateral views of a control embryo (C) or an IGF-2a mRNA injected embryo (D) at 2-somite stage. Note the shortened A-P axis and more posterior tissues in (D). (E–H) Dorsal view of a control (E, G) or an IGF-2a mRNA injected embryo (F, H) at the 5-somite (E and F) and 15-somite stages (G and H). All embryos are dorsal views with head up. Arrows indicate the width of the notochord. Black bars in panels E and F show the width of the somite. Scale bar = 200 μm. (I–L) Morphology of a GFP mRNA injected control embryo (I and K) and an IGF-2a mRNA injected embryo (J and L) at 24 hpf. I and J are lateral views with head to the left and K and L are dorsal views with head to the left. MB, mid brain; OtV, otic vesicle; NC, notochord. Scale bar = 200 μm. (M) Dose-dependent effects of various IGFs in zebrafish embryos. The results are means of 3–4 independent experiments.