
Fig. 6
- ID
- ZDB-FIG-090923-23
- Publication
- Zou et al., 2009 - Zebrafish IGF genes: gene duplication, conservation and divergence, and novel roles in midline and notochord development
- Other Figures
- All Figure Page
- Back to All Figure Page
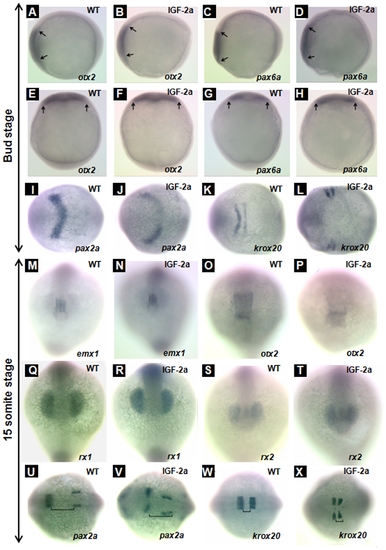
Effect of IGF-2a expression. otx2 expression in the anterior neural plate at the bud stage in a control embryo (panels A and E) and an IGF-2a mRNA injected embryo (panels B and F). pax6a expression in the anterior neural plate at the bud stage in a control embryo (panels C and G) and an IGF-2a mRNA injected embryo (panels D and H). pax2a expression in the midbrain hindbrain boundary at the bud stage in a control embryo (panel I) and an IGF-2a mRNA injected embryo (panel J). krox20 expression in the rhombomere 3 and 5 at the bud stage in a control embryo (panel K) and an IGF-2a mRNA injected embryo (panel L). emx1 expression in the forebrain at the 15-somite stage in a control embryo (panel M) and an IGF-2a mRNA injected embryo (panel N). otx2 expression in the midbrain at the 15-somite stage in a control embryo (panel O) and an IGF-2a mRNA injected embryo (panel P). rx1 expression in the optic vesicle at the 15-somite stage in a control embryo (panel Q) and an IGF-2a mRNA injected embryo (panel R). rx2 expression in the optic vesicle at the 15-somite stage in a control embryo (panel S) and an IGF-2a mRNA injected embryo (panel T). pax2a expression in the midbrain hindbrain boundary at the 15-somite stage in a control embryo (panel U) and an IGF-2a mRNA injected embryo (panel V). krox20 expression in the rhombomere 3 and 5 at the 15-somite stage in a control embryo (panel W) and a 500 pg IGF-2a mRNA injected embryo (panel X). Panels A–D, lateral view, head left; panels E–H, dorsal view, head up; panels I–L and U–X, dorsal view, head left; panels M–T, front view. Black line in panels U, V indicates the gap between the midbrain hindbrain boundary and otic vesicle; black line in panels W, X indicates the gap between rhombomere 3 and 5. |
| Genes: | |
|---|---|
| Fish: | |
| Anatomical Terms: | |
| Stage Range: | Bud to 14-19 somites |