
Image
|
Figure Caption
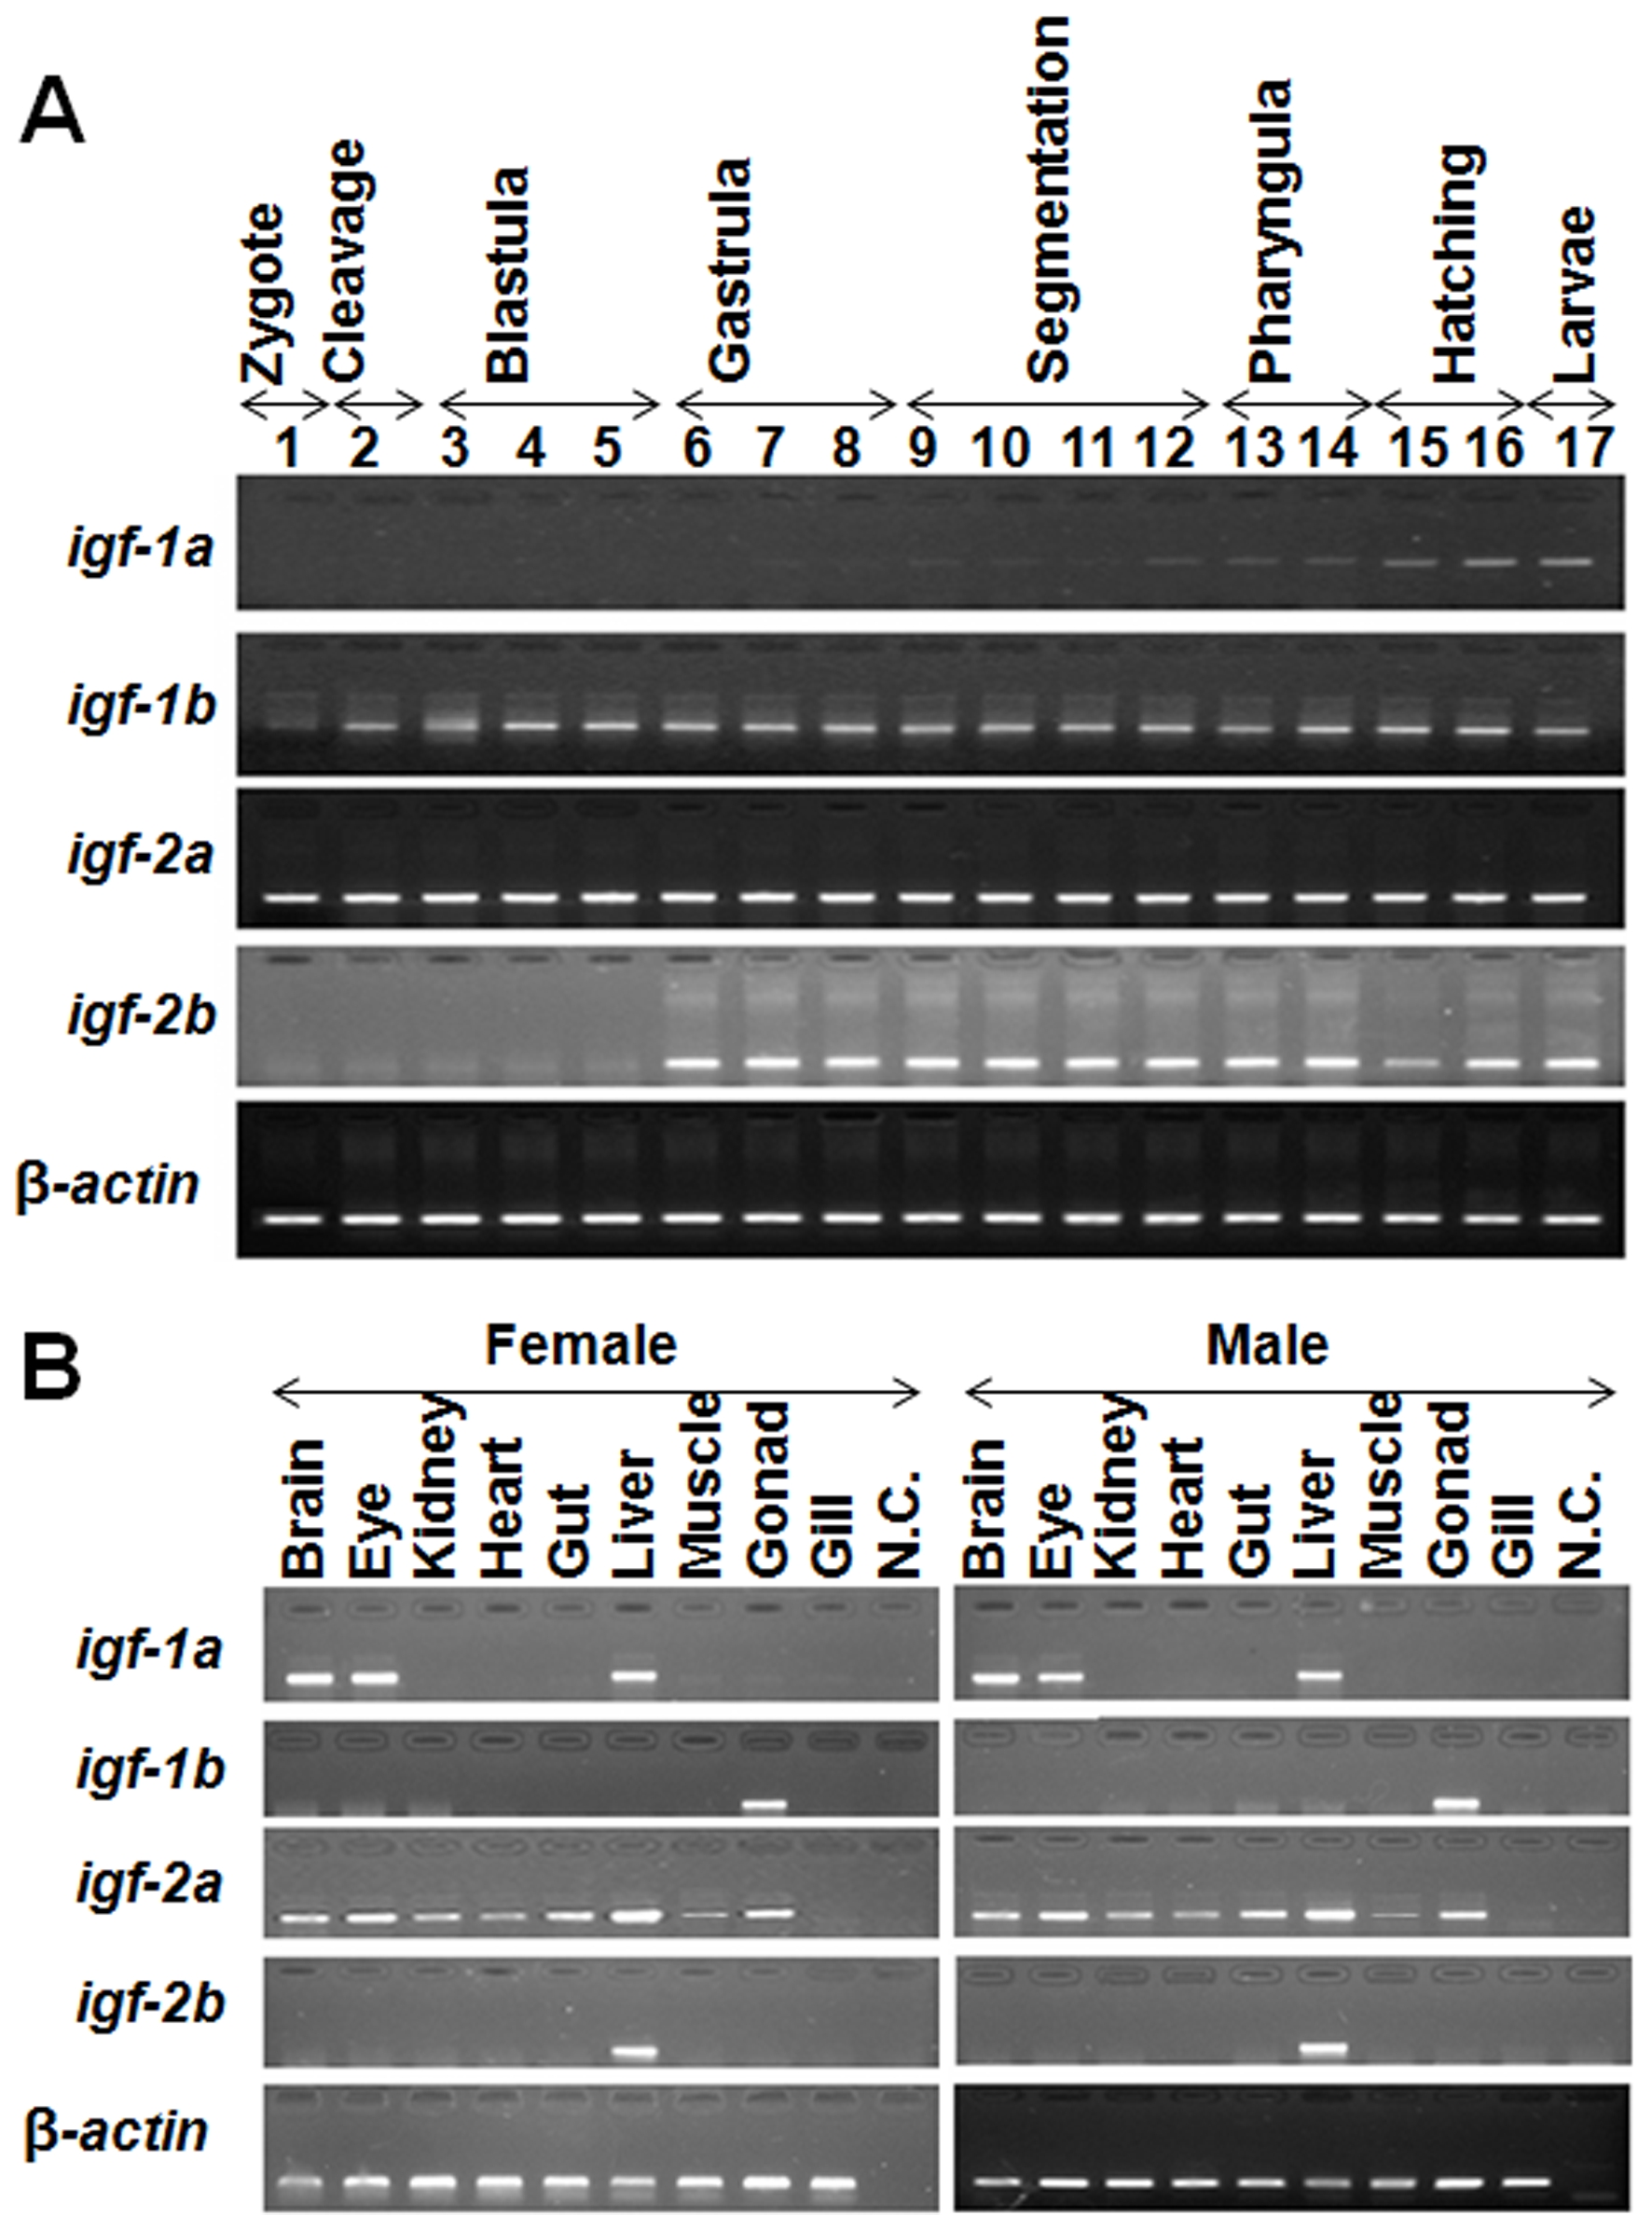
Fig. 4 Temporal and spatial expression patterns of the duplicated zebrafish IGF genes.
(A) RT-PCR analysis of IGF mRNAs in zebrafish embryos at the indicated stages. Numbers are the different embryo developmental stages (1, 1–2 cell; 2, 32-cell; 3, 512-cell; 4, oblong; 5, 30%-epiboly; 6, 50%-epiboly; 7, 90%-epiboly; 8, tailbud; 9, 2-somite; 10, 12-somite; 11, 18-somite; 12, 24–26 somite; 13, Prim-6; 14, Prim-22; 15, 48hpf; 16, 72hpf; 17, 96hpf). (B) RT-PCR analysis of IGF mRNAs in female and male adult zebrafish tissues.
Figure Data
Acknowledgments
This image is the copyrighted work of the attributed author or publisher, and
ZFIN has permission only to display this image to its users.
Additional permissions should be obtained from the applicable author or publisher of the image.
Full text @ PLoS One