
- Title
-
Modularity of the segmentation clock and morphogenesis
- Authors
- Hammond, J.E., Baker, R.E., Verd, B.
- Source
- Full text @ Elife
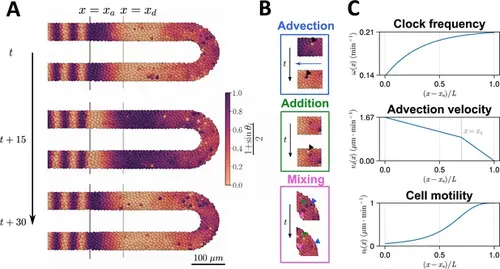
Computational model of the clock and the pre-somitic mesoderm (PSM). (A) Stills of a simulation of the model of Uriu et al., 2021. Kinematic phase (θi ) waves emerge in the posterior (right) and travel towards the tissue anterior (left, x=xa ), where phase is arrested. The model is parameterised to data from zebrafish, and accordingly the clock oscillates every 30 min. (B) Insets illustrating the key processes driving cell movements in the PSM within the model. Top: Cells advect towards the anterior of the tissue, simulating elongation of the PSM. Middle: New cells are added to replenish the loss of cellular material as cells advect towards the anterior. Bottom: Cells undergo motility-driven rearrangements. (C) Functions in the model describing (top) the intrinsic oscillation frequency, (middle) the advection velocity, (bottom) and the motility, of each cell depending on its normalised position along the anterior-posterior axis, (x−xa)/L . Plots were generated using the parameters given by Uriu et al., 2021. |
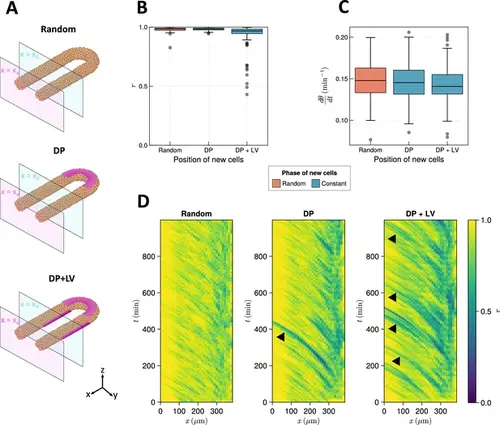
The effect of cell ingression position on clock frequency and synchrony. (A) Diagram highlighting the position of cell addition across the three ingression scenarios tested here. Magenta shading shows where cells are added onto the tissue surface. The pale magenta and blue planes respectively correspond to the anterior limit of the pre-somitic mesoderm (PSM), x=xa , and the anterior limit of cell addition, x=xd . In the ‘Random’ condition cells are added at random positions within the PSM posterior to the plane x=xd , and accordingly no magenta surface is shown. Similarly in the dorso-posterior case (‘DP’) cells are added at random positions in the two lateral cylinders to maintain density, and no magenta surface is shown there. In the dorso-posterior+lateral-ventral (‘DP+LV’) case, cells are only added on the tissue surface at the positions shown by magenta shading. (B) Oscillation synchrony (r ) at the PSM anterior after 1000 min, for the three tested scenarios of cell ingression. N=100 simulations. (C) Mean frequency of oscillations for cells at the PSM anterior after 1000 min of simulation, for the three tested scenarios of cell ingression. N=100 simulations. (D) Kymographs of synchrony along the x -axis on the left-hand side of the PSM for single simulations from each of the three scenarios of cell ingression tested. Black arrowheads highlight strongly asynchronous populations of cells being transported to the tissue anterior by advection. |
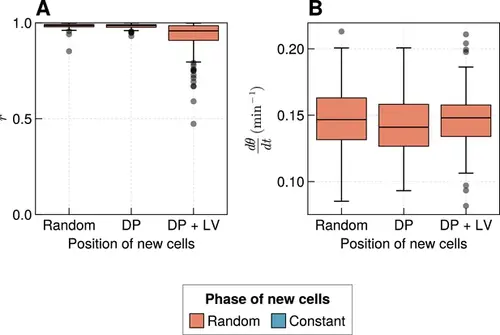
Effect of varying cell ingression position with random initial phases. (A) Oscillation synchrony (r ) at the pre-somitic mesoderm (PSM) anterior after 1000 min, for the three tested scenarios of cell ingression, with ingressing cells having random initial phase θi∈[0,2π). N=100 simulations. (B) Mean frequency of oscillations for cells at the PSM anterior after 1000 min of simulation, for the three tested scenarios of cell ingression, with ingressing cells having random initial phase θi∈[0,2π). N=100 simulations. |
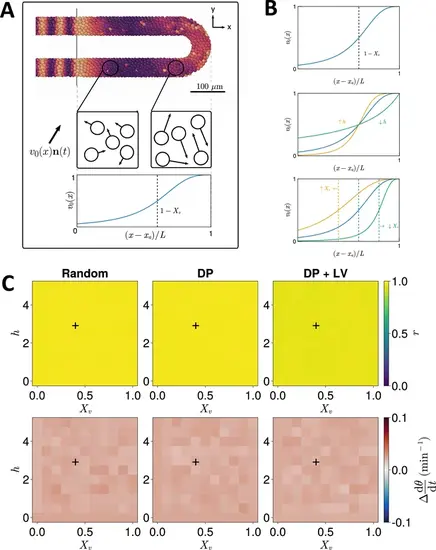
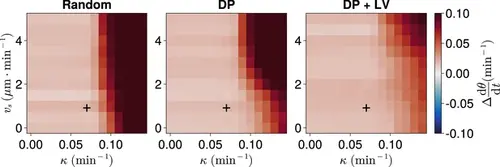
Effect of cell motility profile on clock frequency and synchrony. (A) Overview of how intrinsic cell motion is encoded in the model. Each cell is given a random direction vector v0(xi)ni(t) (black arrows) whose magnitude v0(xi) increases towards the pre-somitic mesoderm (PSM) posterior. (B) Magnitude of intrinsic cell motion v0(x) for the parameters used by Uriu et al., 2021 (blue), and how the shape of the function can change when increasing (yellow) or decreasing (green) the inflexion point and curve steepness parameters, Xv and h , respectively. (C) Clock synchrony r (top) and difference from expected mean frequency Δdθ/dt (bottom) for different v0(x) specified by combinations of Xv and h . The corresponding pixels display the synchrony or frequency at the PSM anterior after 1000 min of simulation using the specified motility profile, averaged across N=100 simulations. A black + corresponds to the parameter pair used elsewhere in this paper, unless otherwise stated (Xv=0.4,h=3 ). Parameter ranges used are Xv∈{0,0.1,0.2,…,1} and h∈{0,0.5,1,…,5} . |
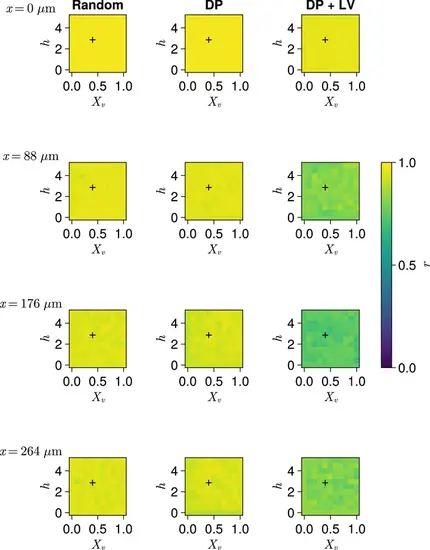
Clock synchrony along the x-axis for varying profiles of cell motility. Clock synchrony r for different motility profiles v0(x) specified by combinations of Xv and h , across three different scenarios of cell ingression. Each row corresponds to synchrony in different cell diameter (dc )-wide subsection of the pre-somitic mesoderm (PSM), with the x-coordinate of this subsection shown on the left-hand side of the figure. Pixels display the synchrony at the PSM anterior after 1000 min of simulation, averaged across N=100 simulations. A black + corresponds to the parameter pair used elsewhere in this paper, unless otherwise stated (Xv=0.4,h=3 ). Parameter ranges used are Xv∈{0,0.1,0.2,…,1} and h∈{0,0.5,1,…,5} . |
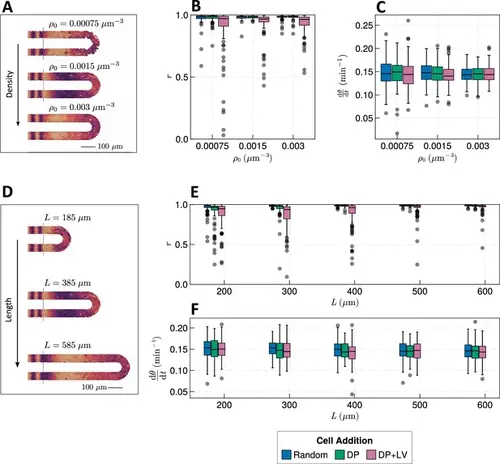
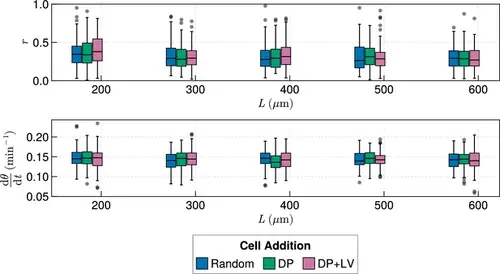
Effect of tissue density and length. (A) Stills from exemplar simulations illustrating the impact of changes in tissue density ρ0 . (B) Anterior synchrony after 1000 min for changing tissue density ρ0 and varying position of cell ingression. N=100 simulations. (C) Anterior mean frequency after 1000 min for changing tissue density ρ0 and varying position of cell ingression. N=100 simulations. (D) Stills from exemplar simulations illustrating changes in tissue length. (E) Anterior synchrony after 1000 min for changing tissue length L and varying position of cell ingression. N=100 simulations. (F) Anterior mean frequency after 1000 min for changing tissue length L and varying position of cell ingression. N=100 simulations. |
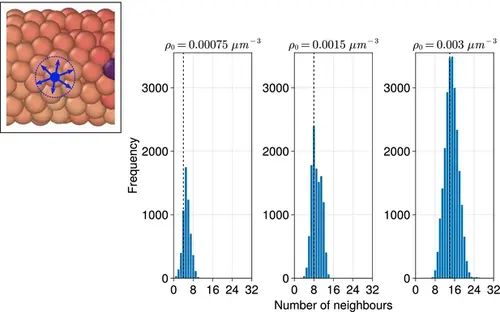
Distribution of the number of neighbours for each cell when varying the density (ρ0 ) of the tissue. Distributions are calculated from final timepoints of individual simulations with random cell ingression with ρ0=0.00075,0.0015,0.003µm−3 by calculating the number of non-self cells within a cell’s radius (dc ) of each cell (see inset, left). The median of each distribution is shown with a black dashed line. |
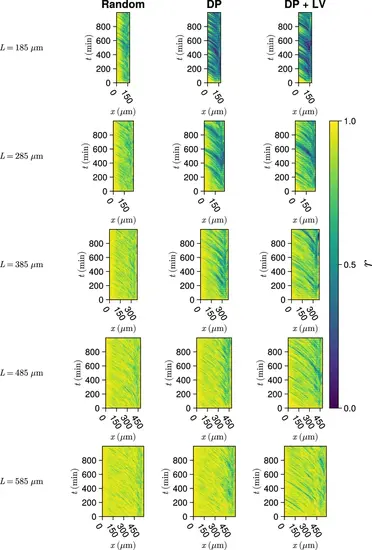
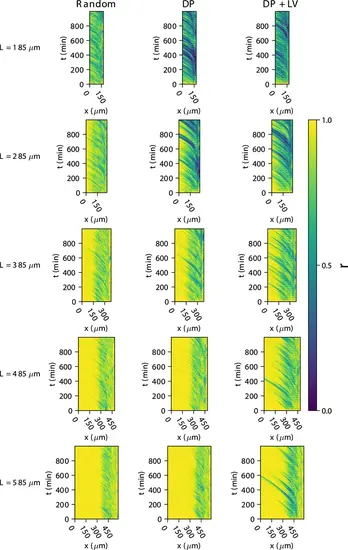
Synchrony dynamics for varying tissue length L . Kymographs of synchrony along the x -axis on the left-hand side of the pre-somitic mesoderm (PSM) for single simulations from each of the three scenarios of cell ingression tested. Tissue length L for each simulation is shown on the left-hand side. The anterior limit of cell addition xd is fixed at xd=100 and is annotated with a black dashed line. |
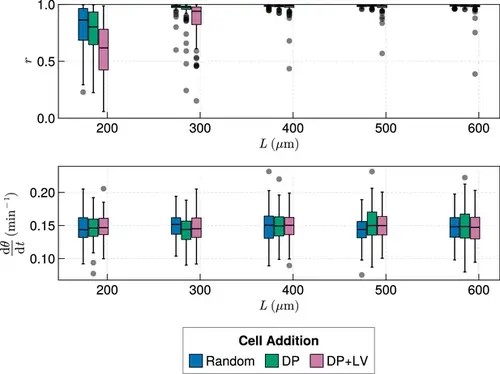
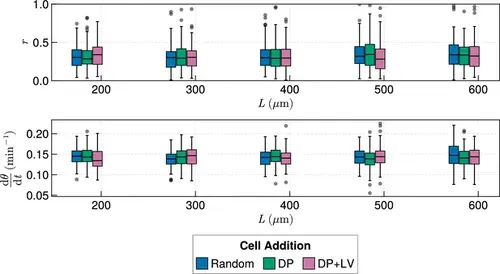
Anterior synchrony for varying tissue length L , with varying anterior limit of cell addition xd . Top: Anterior synchrony after 1000 min for changing tissue length L and varying position of cell ingression, where xd is fixed at xd=L−R−rT−100. N=100 simulations. Bottom: Anterior mean frequency after 1000 min for changing tissue length L and varying position of cell ingression where xd is fixed at xd=L−R−rT−100. N=100 simulations. |
Anterior synchrony for varying tissue length L , with varying anterior limit of cell addition xd . Top: Anterior synchrony after 1000 min for changing tissue length L and varying position of cell ingression, where xd is fixed at xd=L−R−rT−100. N=100 simulations. Bottom: Anterior mean frequency after 1000 min for changing tissue length L and varying position of cell ingression where xd is fixed at xd=L−R−rT−100. N=100 simulations. |
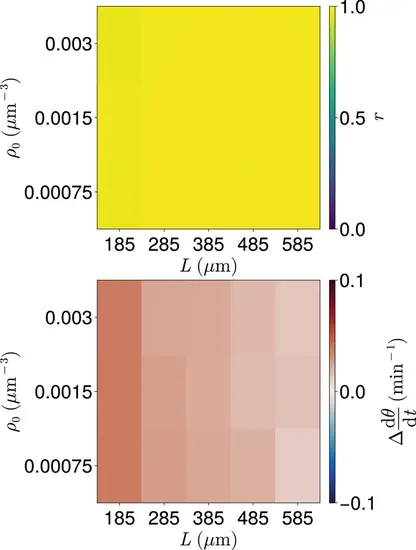
Clock dynamics for co-varying density ρ0 and length L . Median synchrony r (top) and difference from expected mean frequency Δdθ/dt (bottom) at the anterior of the tissue after t=999 min, for co-varying values of tissue density ρ0 and tissue length L . Cell ingression is at random positions and with random phase θ∈[0,2π) . For smaller values of ρ0 gaps in the tissue can occur and no cells occur in the dc -wide region at the tissue anterior at the final timestep. Such simulations where this occur are excluded from this analysis. As a result for each parameter pair the sample size N is 91≤N≤100 . |

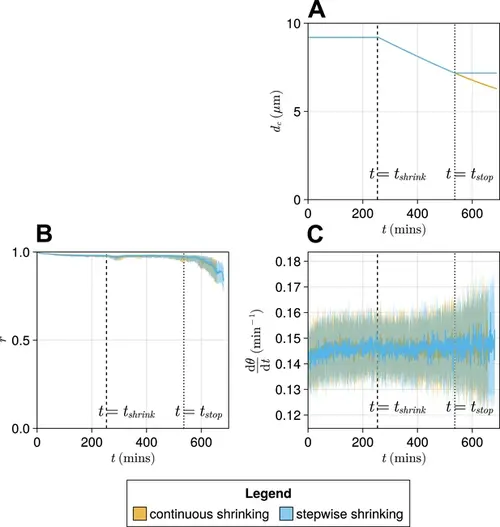
Effect of compaction-extension on clock synchrony and frequency. (A) Snapshots of an exemplar simulation showing how the pre-somitic mesoderm (PSM) shrinks in length and diameter as time progresses. A 100 µm scalebar is shown in the lower right-hand side of the figure. (B) Functions for PSM length L , radius rT , density ρ , and cell diameter dc , derived from Thomson et al., 2021 (yellow), and the constant functions (blue) with which the effect of these functions is compared. (C) Anterior synchrony and (D) mean anterior frequency over time, for N=100 simulations. The solid line indicates the median and the inter-quartile range is given by a shaded band either side of this line. Blue shows simulations where the tissue does not undergo compaction-extension after tshrink , and yellow shows simulations where after tshrink the tissue undergoes compaction-extension according to the functions shown in B. Results are plotted until the time at which at least one of the replicate simulations encounters a gap in the tissue at the tissue anterior (see Methods). |
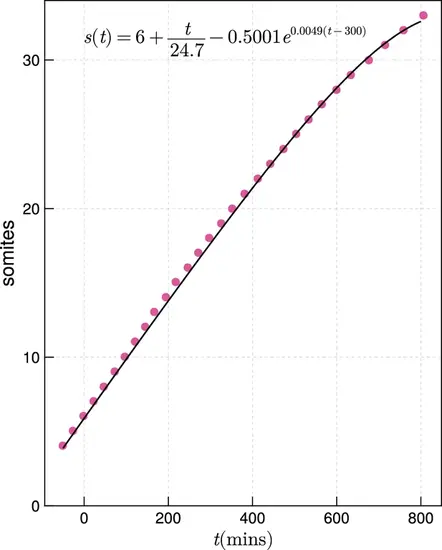
Zebrafish somitogenesis, after Schröter et al., 2008. Fitted function interpolating the data for zebrafish somitogenesis from Schröter et al., 2008 (black), against the raw data (magenta). |
Comparison of a ‘stepwise’ function for decreasing cell diameter dc against a continuously decreasing function. (A) The stepwise (blue) and continuous (yellow) functions compared here. The intercept and gradient for these functions are derived from data from Thomson et al., 2021. (B) Anterior synchrony (r ) over time for stepwise shrinking cells (blue) and continuously shrinking cells (yellow). Dark line shows the median of N=100 simulations, and the shaded area either side of this line shows the inter-quartile range (IQR). Results are plotted until the time at which at least one of the replicate simulations encounters a gap in the tissue at the tissue anterior (see Methods). (C) Mean anterior frequency (dθ/dt ) over time for stepwise shrinking cells (blue) and continuously shrinking cells (yellow). Dark line shows the median of N=100 simulations, and the shaded area either side of this line shows the IQR. Results are plotted until the time at which at least one of the replicate simulations encounters a gap in the tissue at the tissue anterior. |

Effect of starting tissue density d0 on anterior synchrony and frequency over time, for a compacting tissue. (A) Functions showing tissue density ρ(t) for different intercept values d0 . (B) Anterior synchrony (r ) over time. Dark line shows the median of N=100 simulations, and the shaded area either side of this line shows the inter-quartile range (IQR). Results are plotted until the time at which at least one of the replicate simulations encounters a gap in the tissue at the tissue anterior (see Methods). (C) Mean anterior frequency (dθ/dt ) over time. Dark line shows the median of N=100 simulations, and the shaded area either side of this line shows the IQR. Results are plotted until the time at which at least one of the replicate simulations encounters a gap in the tissue at the tissue anterior. |
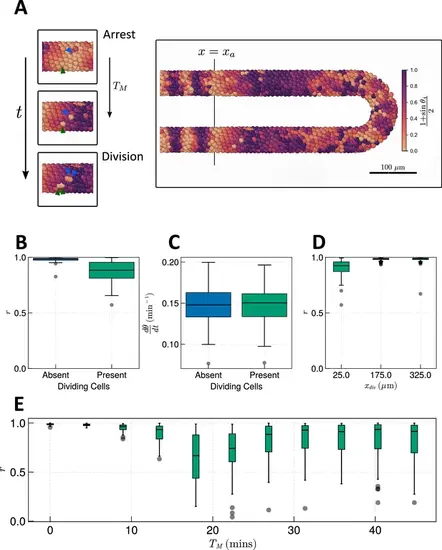
Effect of cell division on clock frequency and synchrony. (A) Diagram showing how during cell division, clock phase θ arrests, causing a cell to fall out of phase with its neighbour. On the right-hand side a still from a simulation for TM = 15 min is shown, illustrating how this creates asynchrony of oscillations. The effect of cell division on anterior synchrony and frequency is shown in figures B and C, respectively, for TM=15 min after 1000 min. N=100 . (D) The effect on anterior synchrony when division is restricted to only occur posterior to x=xdiv , for TM=15 min. N=100 . (E) The effect on anterior synchrony after 1000 min when TM is varied. In each case, the total length of the cell cycle is maintained at a constant length, i.e., TM+TG=187.5 min. N=100 . To rule out trivial changes in synchrony and frequency, in all analysis here we restrict measurement to non-dividing cells, i.e., cells such that τ∈[0,TG) . |
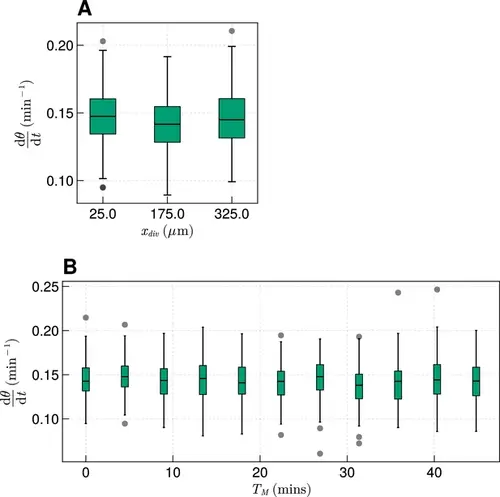
The effect of cell division on frequency. (A) Effect on median frequency when varying xdiv after 1000 min for N=100 simulations. (B) Effect on median frequency when varying TM after 1000 min for N=100 simulations. |
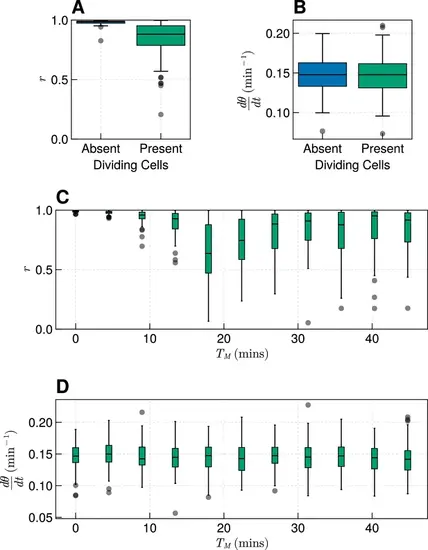
Effect of cell division where clock coupling is forbidden during M-phase. (A) Synchrony at the pre-somitic mesoderm (PSM) anterior after 1000 min in simulations with or without dividing cells, for TM=15 min. Neighbouring cells were forbidden from coupling to neighbours in M-phase. N=100 . (B) Frequency at the PSM anterior after 1000 min in simulations with or without dividing cells, for TM=15 min. Neighbouring cells were forbidden from coupling to neighbours in M-phase. N=100 . (C) Synchrony at the PSM anterior after 1000 min in simulations with or without dividing cells, for varying TM . Neighbouring cells were forbidden from coupling to neighbours in M-phase. N=100 for each value of TM . (D) Frequency at the PSM anterior after 1000 min in simulations with or without dividing cells, for varying TM . Neighbouring cells were forbidden from coupling to neighbours in M-phase. N=100 for each value of TM . |
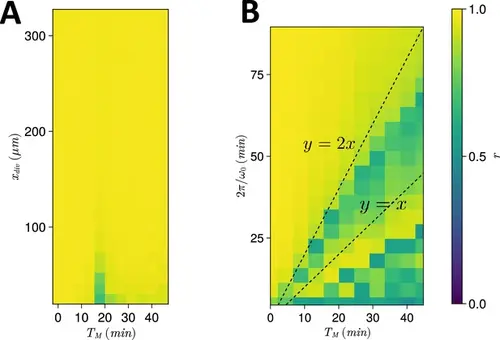
Spatiotemporal constraints on TM . (A) Dependence of anterior synchrony on xdiv and TM . The median anterior synchrony after 1000 min for N=100 simulations is plotted. (B) Dependence of anterior synchrony on TM and intrinsic clock frequency ω0 . The median anterior synchrony after 1000 min for N=100 simulations is plotted. |
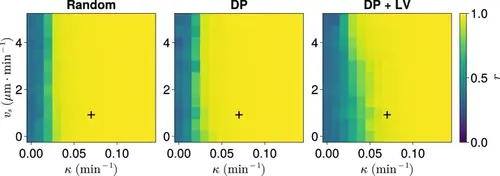
Synchrony for varying coupling strength κ and magnitude of intrinsic cell motion. vs . Anterior synchrony after 1000 min, for varying maximum magnitude of intrinsic cell motion vs and clock phase coupling strength κ , for three different scenarios of cell ingression.Each pixel corresponds to the median value of anterior synchrony across N=100 simulations. A black + marks the experimental values for zebrafish, κ=0.07min−1 , vs=1µm⋅min−1 , derived in Riedel-Kruse et al., 2007, and Uriu et al., 2017, respectively, that are used elsewhere in this paper. All other parameters are held constant at their normal values (see Table 1). |
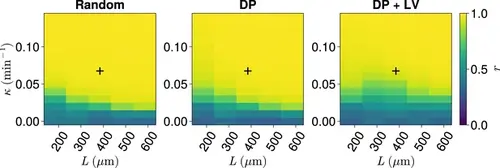
Synchrony for varying coupling strength κ and tissue length L . Effect of co-varying coupling strength κ , tissue length L , and position of cell ingression on the median anterior synchrony of N=100 simulations. A black + corresponds to the parameter pair L=385µm , κ=0.07min−1 . |
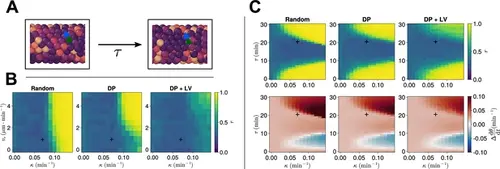
Clock dynamics in the presence of a coupling delay between cells. (A) Diagram illustrating phase coupling with delay. Cells couple their phase to the phase of their neighbours τ min ago. (B) Anterior synchrony in the presence of coupling delay (τ=21min ) after 1000 min, for varying maximum magnitude of intrinsic cell motion vs and clock phase coupling strength κ , for three different scenarios of cell ingression. Each pixel corresponds to the median value of anterior synchrony across N=100 simulations. A black + marks the experimental values for zebrafish, κ=0.07min−1 , vs=1µm⋅min−1 , derived in Riedel-Kruse et al., 2007, and Uriu et al., 2017, respectively, that are used elsewhere in this paper. All other parameters are held constant at their normal values (see Table 1). (C) Anterior synchrony (top) r after 1000 min, for varying phase coupling delay τ and clock phase coupling strength κ , for three different scenarios of cell ingression. Each pixel corresponds to the median value of anterior synchrony across N=100 simulations. Bottom: Difference from expected mean frequency (Δdθ/dt ) at the pre-somitic mesoderm (PSM) anterior after 1000 min, for three different scenarios of cell ingression. Each pixel corresponds to the mean value across N=100 simulations. A black + marks the experimental values for zebrafish, κ=0.07min−1 , τ=21min , derived in Riedel-Kruse et al., 2007, and Herrgen et al., 2010, respectively. All other parameters are held constant at their normal values (see Table 1). |
Frequency in the presence of coupling delay, for varying coupling strength κ and magnitude of intrinsic cell motion. vs . Difference from expected mean frequency (Δdθ/dt ) at the pre-somitic mesoderm (PSM) anterior after 1000 min, for varying maximum magnitude of intrinsic cell motion vs and clock phase coupling strength κ , for three different scenarios of cell ingression. Each pixel corresponds to the median value of anterior synchrony across N=100 simulations. A black + marks the experimental values for zebrafish, κ=0.07min−1 , vs=1µm⋅min−1 , derived in Riedel-Kruse et al., 2007, and Uriu et al., 2017, respectively, that are used elsewhere in this paper. All other parameters are held constant at their normal values (see Table 1). |
Clock dynamics in the presence of a coupling delay, for varying tissue length L . Top: Anterior synchrony after 1000 min for changing tissue length L and varying position of cell ingression. xd is fixed at xd = 100 µm. N=100 simulations. Bottom: Anterior mean frequency after 1000 min for changing tissue length L and varying position of cell ingression. N=100 simulations. |
Clock dynamics in the presence of a coupling delay, for varying tissue length L and anterior limit of cell addition xd . Top: Anterior synchrony after 1000 min for changing tissue length L and varying position of cell ingression. xd is set to xd=L−R−rT−100. N=100 for all simulations, except the DP+LV dataset for L=585µm , where N=99 . Bottom: Anterior mean frequency after 1000 min for changing tissue length L and varying position of cell ingression. xd is set to xd=L−R−rT−100. N=100 for all simulations, except the DP+LV dataset for L=585µm , where N=99 . |
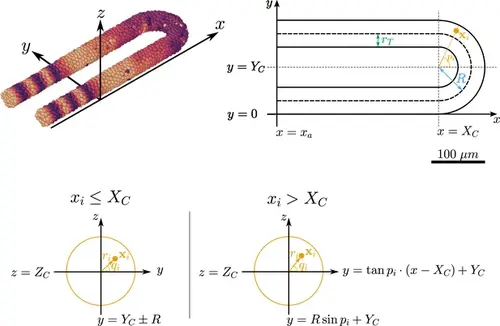
Geometry of the pre-somitic mesoderm (PSM) assumed in the present model. Top left: Major axes (x , y , z ) used in the model. x corresponds to the anterior-posterior axis of the embryo and increases towards the tissue posterior, y corresponds to the left-right axis and increases to the right-hand side of the tissue, and z corresponds to the dorsal-ventral axis of the embryo. Top right: Schematic of the PSM in the xy plane. The PSM is comprised of two cylinders, centred at y=rT and y=2R+rT , respectively, with radius rT . The ‘tailbud’ is represented as a half-torus subdomain centred at x=(Xc,Yc,Zc)T , with minor radius rT and major radius R . Bottom: Cross sections of the tissue showing how a point xi is assigned the polar coordinates ri and qi , in both the PSM cylinders (xi≤Xc ) and the half-toroid tailbud (xi>Xc ). Adapted from Uriu et al., 2021. |
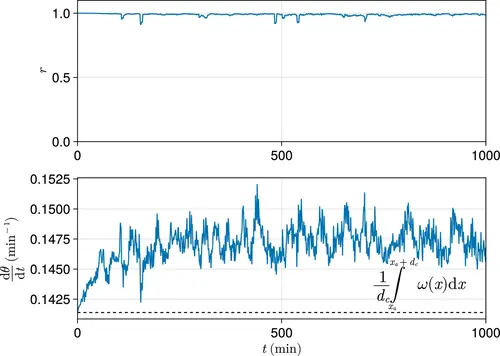
Exemplar dynamics of synchrony and mean anterior frequency. Top: Trace of synchrony r for a dc -wide domain of cells at the left-hand anterior edge of the pre-somitic mesoderm (PSM) over 1000 min. Data drawn from a single simulation with random cell addition, using parameters as per Uriu et al., 2021. Bottom: Trace of mean frequency dθ/dt for a dc -wide domain of cells at the left-hand anterior edge of the PSM over 1000 min. Data drawn from the same simulation as above. Plotted with a black dashed line is the average intrinsic frequency ω(x) across the domain, calculated using the formula shown. |