
FIGURE
Fig. 10
- ID
- ZDB-FIG-250430-203
- Publication
- Hammond et al., 2025 - Modularity of the segmentation clock and morphogenesis
- Other Figures
-
- Fig. 1
- Fig. 2
- Fig. 2 - Supplemental 1
- Fig. 3
- Fig. 3 - Supplemental 1
- Fig. 4
- Fig. 4 - Supplemental 1
- Fig. 4 - Supplemental 2
- Fig. 4 - Supplemental 3
- Fig. 4 - Supplemental 4
- Fig. 4 - Supplemental 5
- Fig. 5
- Fig. 5 - Supplemental 1
- Fig. 5 - Supplemental 2
- Fig. 5 - Supplemental 3
- Fig. 6
- Fig. 6 - Supplemental 1
- Fig. 6 - Supplemental 2
- Fig. 6 - Supplemental 3
- Fig. 7
- Fig. 7 - Supplemental 1
- Fig. 8
- Fig. 8 - Supplemental 1
- Fig. 8 - Supplemental 2
- Fig. 8 - Supplemental 3
- Fig. 9
- Fig. 10
- All Figure Page
- Back to All Figure Page
Fig. 10
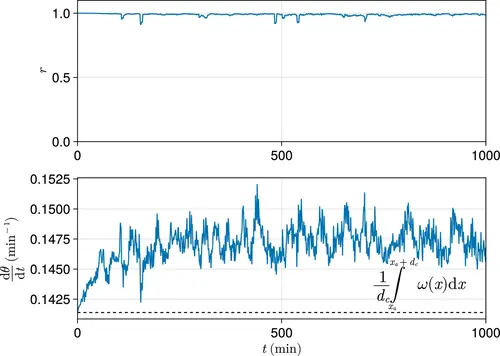
Exemplar dynamics of synchrony and mean anterior frequency. Top: Trace of synchrony r for a dc -wide domain of cells at the left-hand anterior edge of the pre-somitic mesoderm (PSM) over 1000 min. Data drawn from a single simulation with random cell addition, using parameters as per Uriu et al., 2021. Bottom: Trace of mean frequency dθ/dt for a dc -wide domain of cells at the left-hand anterior edge of the PSM over 1000 min. Data drawn from the same simulation as above. Plotted with a black dashed line is the average intrinsic frequency ω(x) across the domain, calculated using the formula shown. |
Expression Data
Expression Detail
Antibody Labeling
Phenotype Data
Phenotype Detail
Acknowledgments
This image is the copyrighted work of the attributed author or publisher, and
ZFIN has permission only to display this image to its users.
Additional permissions should be obtained from the applicable author or publisher of the image.
Full text @ Elife