
|
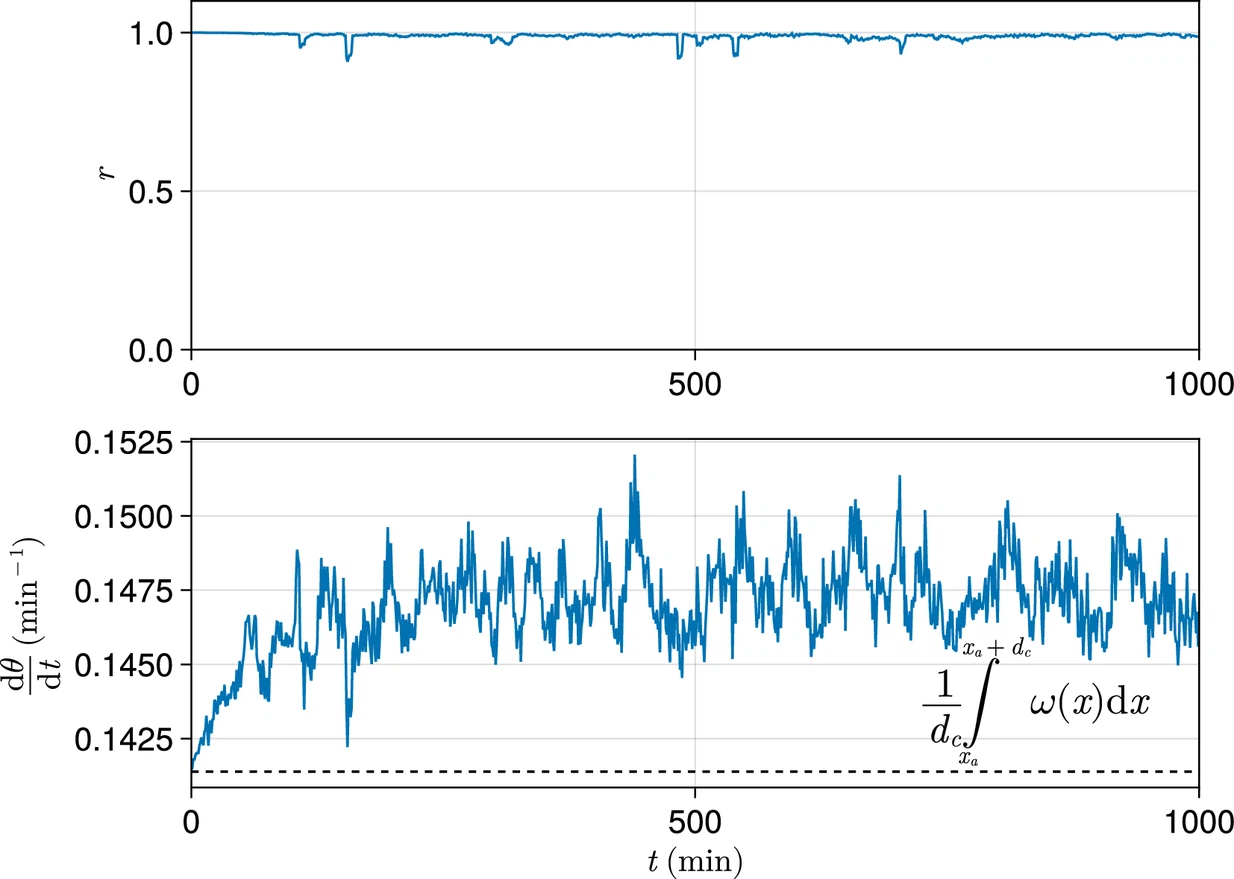
Fig. 10 Exemplar dynamics of synchrony and mean anterior frequency. Top: Trace of synchrony r for a dc -wide domain of cells at the left-hand anterior edge of the pre-somitic mesoderm (PSM) over 1000 min. Data drawn from a single simulation with random cell addition, using parameters as per Uriu et al., 2021. Bottom: Trace of mean frequency dθ/dt for a dc -wide domain of cells at the left-hand anterior edge of the PSM over 1000 min. Data drawn from the same simulation as above. Plotted with a black dashed line is the average intrinsic frequency ω(x) across the domain, calculated using the formula shown.