
Fig. 6
- ID
- ZDB-FIG-250430-192
- Publication
- Hammond et al., 2025 - Modularity of the segmentation clock and morphogenesis
- Other Figures
-
- Fig. 1
- Fig. 2
- Fig. 2 - Supplemental 1
- Fig. 3
- Fig. 3 - Supplemental 1
- Fig. 4
- Fig. 4 - Supplemental 1
- Fig. 4 - Supplemental 2
- Fig. 4 - Supplemental 3
- Fig. 4 - Supplemental 4
- Fig. 4 - Supplemental 5
- Fig. 5
- Fig. 5 - Supplemental 1
- Fig. 5 - Supplemental 2
- Fig. 5 - Supplemental 3
- Fig. 6
- Fig. 6 - Supplemental 1
- Fig. 6 - Supplemental 2
- Fig. 6 - Supplemental 3
- Fig. 7
- Fig. 7 - Supplemental 1
- Fig. 8
- Fig. 8 - Supplemental 1
- Fig. 8 - Supplemental 2
- Fig. 8 - Supplemental 3
- Fig. 9
- Fig. 10
- All Figure Page
- Back to All Figure Page
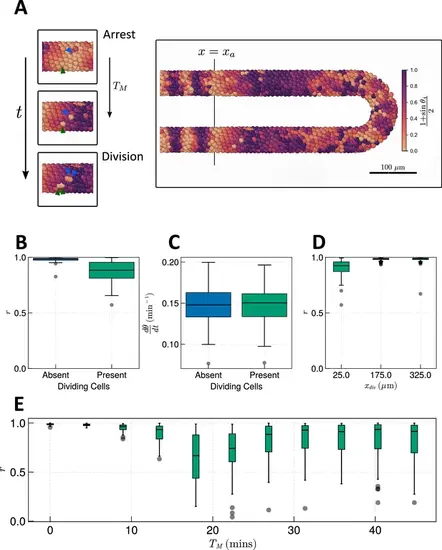
Effect of cell division on clock frequency and synchrony. (A) Diagram showing how during cell division, clock phase θ arrests, causing a cell to fall out of phase with its neighbour. On the right-hand side a still from a simulation for TM = 15 min is shown, illustrating how this creates asynchrony of oscillations. The effect of cell division on anterior synchrony and frequency is shown in figures B and C, respectively, for TM=15 min after 1000 min. N=100 . (D) The effect on anterior synchrony when division is restricted to only occur posterior to x=xdiv , for TM=15 min. N=100 . (E) The effect on anterior synchrony after 1000 min when TM is varied. In each case, the total length of the cell cycle is maintained at a constant length, i.e., TM+TG=187.5 min. N=100 . To rule out trivial changes in synchrony and frequency, in all analysis here we restrict measurement to non-dividing cells, i.e., cells such that τ∈[0,TG) . |