
Fig. 3 - Supplemental 1
- ID
- ZDB-FIG-250430-181
- Publication
- Hammond et al., 2025 - Modularity of the segmentation clock and morphogenesis
- Other Figures
-
- Fig. 1
- Fig. 2
- Fig. 2 - Supplemental 1
- Fig. 3
- Fig. 3 - Supplemental 1
- Fig. 4
- Fig. 4 - Supplemental 1
- Fig. 4 - Supplemental 2
- Fig. 4 - Supplemental 3
- Fig. 4 - Supplemental 4
- Fig. 4 - Supplemental 5
- Fig. 5
- Fig. 5 - Supplemental 1
- Fig. 5 - Supplemental 2
- Fig. 5 - Supplemental 3
- Fig. 6
- Fig. 6 - Supplemental 1
- Fig. 6 - Supplemental 2
- Fig. 6 - Supplemental 3
- Fig. 7
- Fig. 7 - Supplemental 1
- Fig. 8
- Fig. 8 - Supplemental 1
- Fig. 8 - Supplemental 2
- Fig. 8 - Supplemental 3
- Fig. 9
- Fig. 10
- All Figure Page
- Back to All Figure Page
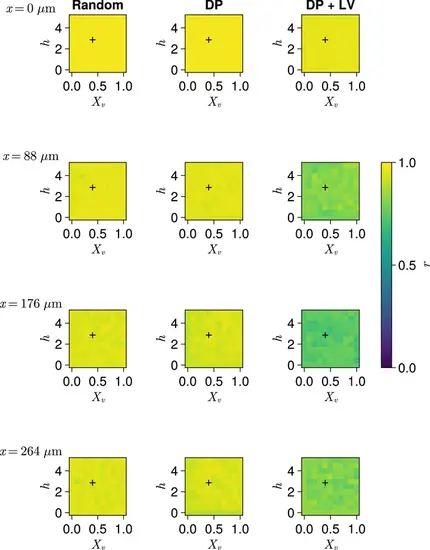
Clock synchrony along the x-axis for varying profiles of cell motility. Clock synchrony r for different motility profiles v0(x) specified by combinations of Xv and h , across three different scenarios of cell ingression. Each row corresponds to synchrony in different cell diameter (dc )-wide subsection of the pre-somitic mesoderm (PSM), with the x-coordinate of this subsection shown on the left-hand side of the figure. Pixels display the synchrony at the PSM anterior after 1000 min of simulation, averaged across N=100 simulations. A black + corresponds to the parameter pair used elsewhere in this paper, unless otherwise stated (Xv=0.4,h=3 ). Parameter ranges used are Xv∈{0,0.1,0.2,…,1} and h∈{0,0.5,1,…,5} . |