
Fig. 4
- ID
- ZDB-FIG-250430-182
- Publication
- Hammond et al., 2025 - Modularity of the segmentation clock and morphogenesis
- Other Figures
-
- Fig. 1
- Fig. 2
- Fig. 2 - Supplemental 1
- Fig. 3
- Fig. 3 - Supplemental 1
- Fig. 4
- Fig. 4 - Supplemental 1
- Fig. 4 - Supplemental 2
- Fig. 4 - Supplemental 3
- Fig. 4 - Supplemental 4
- Fig. 4 - Supplemental 5
- Fig. 5
- Fig. 5 - Supplemental 1
- Fig. 5 - Supplemental 2
- Fig. 5 - Supplemental 3
- Fig. 6
- Fig. 6 - Supplemental 1
- Fig. 6 - Supplemental 2
- Fig. 6 - Supplemental 3
- Fig. 7
- Fig. 7 - Supplemental 1
- Fig. 8
- Fig. 8 - Supplemental 1
- Fig. 8 - Supplemental 2
- Fig. 8 - Supplemental 3
- Fig. 9
- Fig. 10
- All Figure Page
- Back to All Figure Page
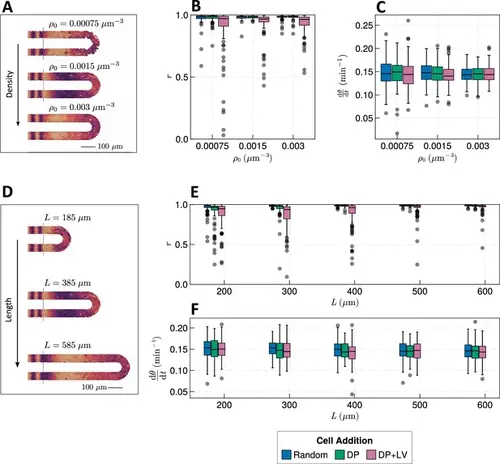
Effect of tissue density and length. (A) Stills from exemplar simulations illustrating the impact of changes in tissue density ρ0 . (B) Anterior synchrony after 1000 min for changing tissue density ρ0 and varying position of cell ingression. N=100 simulations. (C) Anterior mean frequency after 1000 min for changing tissue density ρ0 and varying position of cell ingression. N=100 simulations. (D) Stills from exemplar simulations illustrating changes in tissue length. (E) Anterior synchrony after 1000 min for changing tissue length L and varying position of cell ingression. N=100 simulations. (F) Anterior mean frequency after 1000 min for changing tissue length L and varying position of cell ingression. N=100 simulations. |