
FIGURE
Fig. 4 - Supplemental 5
- ID
- ZDB-FIG-250430-187
- Publication
- Hammond et al., 2025 - Modularity of the segmentation clock and morphogenesis
- Other Figures
-
- Fig. 1
- Fig. 2
- Fig. 2 - Supplemental 1
- Fig. 3
- Fig. 3 - Supplemental 1
- Fig. 4
- Fig. 4 - Supplemental 1
- Fig. 4 - Supplemental 2
- Fig. 4 - Supplemental 3
- Fig. 4 - Supplemental 4
- Fig. 4 - Supplemental 5
- Fig. 5
- Fig. 5 - Supplemental 1
- Fig. 5 - Supplemental 2
- Fig. 5 - Supplemental 3
- Fig. 6
- Fig. 6 - Supplemental 1
- Fig. 6 - Supplemental 2
- Fig. 6 - Supplemental 3
- Fig. 7
- Fig. 7 - Supplemental 1
- Fig. 8
- Fig. 8 - Supplemental 1
- Fig. 8 - Supplemental 2
- Fig. 8 - Supplemental 3
- Fig. 9
- Fig. 10
- All Figure Page
- Back to All Figure Page
Fig. 4 - Supplemental 5
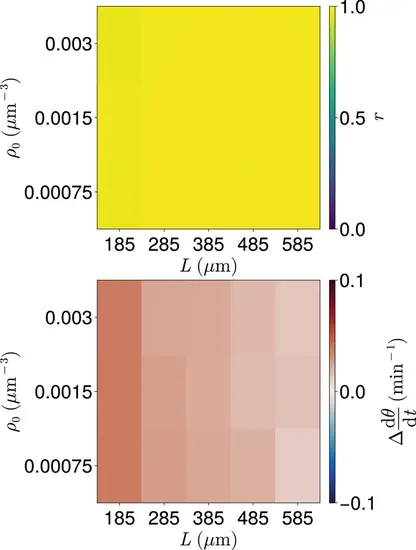
Clock dynamics for co-varying density ρ0 and length L . Median synchrony r (top) and difference from expected mean frequency Δdθ/dt (bottom) at the anterior of the tissue after t=999 min, for co-varying values of tissue density ρ0 and tissue length L . Cell ingression is at random positions and with random phase θ∈[0,2π) . For smaller values of ρ0 gaps in the tissue can occur and no cells occur in the dc -wide region at the tissue anterior at the final timestep. Such simulations where this occur are excluded from this analysis. As a result for each parameter pair the sample size N is 91≤N≤100 . |
Expression Data
Expression Detail
Antibody Labeling
Phenotype Data
Phenotype Detail
Acknowledgments
This image is the copyrighted work of the attributed author or publisher, and
ZFIN has permission only to display this image to its users.
Additional permissions should be obtained from the applicable author or publisher of the image.
Full text @ Elife