
Fig. 1
- ID
- ZDB-FIG-250430-177
- Publication
- Hammond et al., 2025 - Modularity of the segmentation clock and morphogenesis
- Other Figures
-
- Fig. 1
- Fig. 2
- Fig. 2 - Supplemental 1
- Fig. 3
- Fig. 3 - Supplemental 1
- Fig. 4
- Fig. 4 - Supplemental 1
- Fig. 4 - Supplemental 2
- Fig. 4 - Supplemental 3
- Fig. 4 - Supplemental 4
- Fig. 4 - Supplemental 5
- Fig. 5
- Fig. 5 - Supplemental 1
- Fig. 5 - Supplemental 2
- Fig. 5 - Supplemental 3
- Fig. 6
- Fig. 6 - Supplemental 1
- Fig. 6 - Supplemental 2
- Fig. 6 - Supplemental 3
- Fig. 7
- Fig. 7 - Supplemental 1
- Fig. 8
- Fig. 8 - Supplemental 1
- Fig. 8 - Supplemental 2
- Fig. 8 - Supplemental 3
- Fig. 9
- Fig. 10
- All Figure Page
- Back to All Figure Page
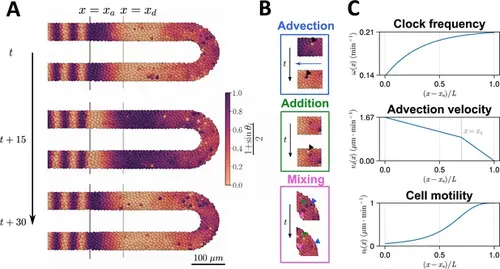
Computational model of the clock and the pre-somitic mesoderm (PSM). (A) Stills of a simulation of the model of Uriu et al., 2021. Kinematic phase (θi ) waves emerge in the posterior (right) and travel towards the tissue anterior (left, x=xa ), where phase is arrested. The model is parameterised to data from zebrafish, and accordingly the clock oscillates every 30 min. (B) Insets illustrating the key processes driving cell movements in the PSM within the model. Top: Cells advect towards the anterior of the tissue, simulating elongation of the PSM. Middle: New cells are added to replenish the loss of cellular material as cells advect towards the anterior. Bottom: Cells undergo motility-driven rearrangements. (C) Functions in the model describing (top) the intrinsic oscillation frequency, (middle) the advection velocity, (bottom) and the motility, of each cell depending on its normalised position along the anterior-posterior axis, (x−xa)/L . Plots were generated using the parameters given by Uriu et al., 2021. |