
|
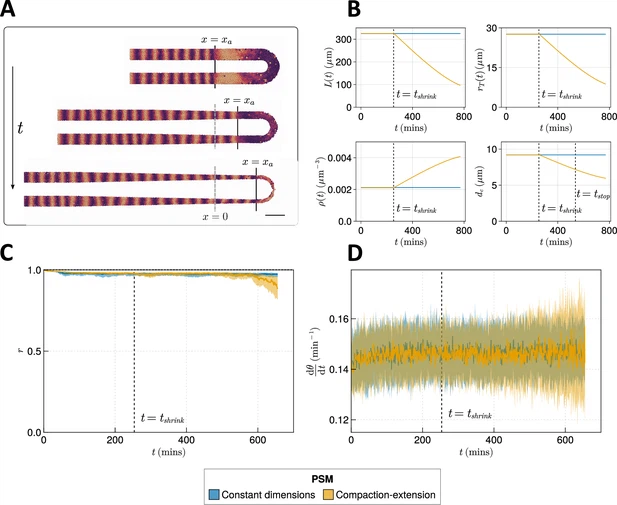
Fig. 5 Effect of compaction-extension on clock synchrony and frequency. (A) Snapshots of an exemplar simulation showing how the pre-somitic mesoderm (PSM) shrinks in length and diameter as time progresses. A 100 µm scalebar is shown in the lower right-hand side of the figure. (B) Functions for PSM length L , radius rT , density ρ , and cell diameter dc , derived from Thomson et al., 2021 (yellow), and the constant functions (blue) with which the effect of these functions is compared. (C) Anterior synchrony and (D) mean anterior frequency over time, for N=100 simulations. The solid line indicates the median and the inter-quartile range is given by a shaded band either side of this line. Blue shows simulations where the tissue does not undergo compaction-extension after tshrink , and yellow shows simulations where after tshrink the tissue undergoes compaction-extension according to the functions shown in B. Results are plotted until the time at which at least one of the replicate simulations encounters a gap in the tissue at the tissue anterior (see Methods).