
|
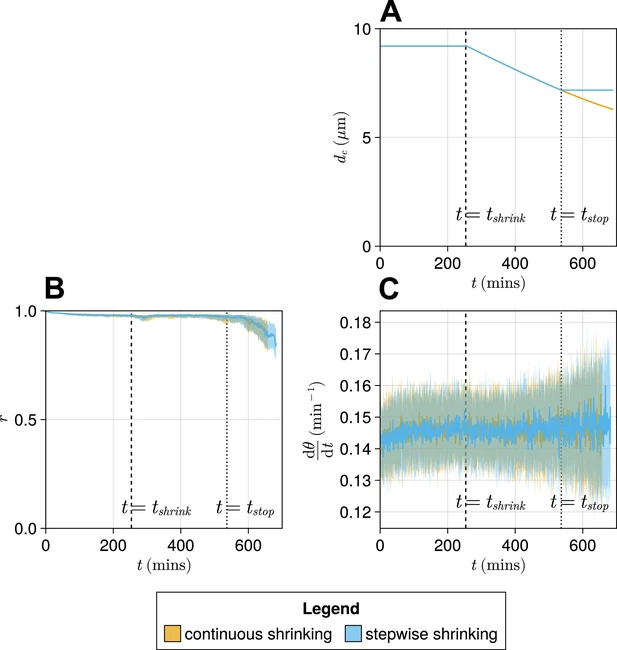
Fig. 5 - Supplemental 2 Comparison of a ‘stepwise’ function for decreasing cell diameter dc against a continuously decreasing function. (A) The stepwise (blue) and continuous (yellow) functions compared here. The intercept and gradient for these functions are derived from data from Thomson et al., 2021. (B) Anterior synchrony (r ) over time for stepwise shrinking cells (blue) and continuously shrinking cells (yellow). Dark line shows the median of N=100 simulations, and the shaded area either side of this line shows the inter-quartile range (IQR). Results are plotted until the time at which at least one of the replicate simulations encounters a gap in the tissue at the tissue anterior (see Methods). (C) Mean anterior frequency (dθ/dt ) over time for stepwise shrinking cells (blue) and continuously shrinking cells (yellow). Dark line shows the median of N=100 simulations, and the shaded area either side of this line shows the IQR. Results are plotted until the time at which at least one of the replicate simulations encounters a gap in the tissue at the tissue anterior.