
Fig. 3
- ID
- ZDB-FIG-250430-180
- Publication
- Hammond et al., 2025 - Modularity of the segmentation clock and morphogenesis
- Other Figures
-
- Fig. 1
- Fig. 2
- Fig. 2 - Supplemental 1
- Fig. 3
- Fig. 3 - Supplemental 1
- Fig. 4
- Fig. 4 - Supplemental 1
- Fig. 4 - Supplemental 2
- Fig. 4 - Supplemental 3
- Fig. 4 - Supplemental 4
- Fig. 4 - Supplemental 5
- Fig. 5
- Fig. 5 - Supplemental 1
- Fig. 5 - Supplemental 2
- Fig. 5 - Supplemental 3
- Fig. 6
- Fig. 6 - Supplemental 1
- Fig. 6 - Supplemental 2
- Fig. 6 - Supplemental 3
- Fig. 7
- Fig. 7 - Supplemental 1
- Fig. 8
- Fig. 8 - Supplemental 1
- Fig. 8 - Supplemental 2
- Fig. 8 - Supplemental 3
- Fig. 9
- Fig. 10
- All Figure Page
- Back to All Figure Page
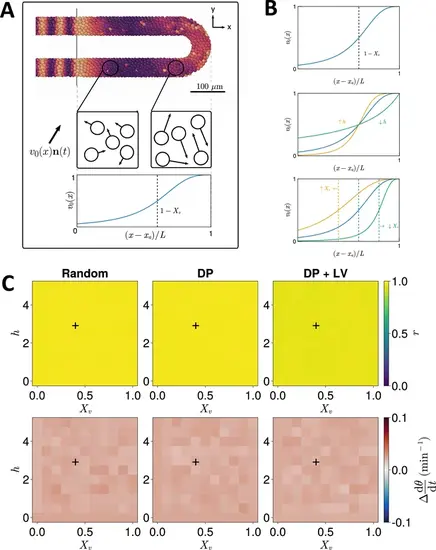
Effect of cell motility profile on clock frequency and synchrony. (A) Overview of how intrinsic cell motion is encoded in the model. Each cell is given a random direction vector v0(xi)ni(t) (black arrows) whose magnitude v0(xi) increases towards the pre-somitic mesoderm (PSM) posterior. (B) Magnitude of intrinsic cell motion v0(x) for the parameters used by Uriu et al., 2021 (blue), and how the shape of the function can change when increasing (yellow) or decreasing (green) the inflexion point and curve steepness parameters, Xv and h , respectively. (C) Clock synchrony r (top) and difference from expected mean frequency Δdθ/dt (bottom) for different v0(x) specified by combinations of Xv and h . The corresponding pixels display the synchrony or frequency at the PSM anterior after 1000 min of simulation using the specified motility profile, averaged across N=100 simulations. A black + corresponds to the parameter pair used elsewhere in this paper, unless otherwise stated (Xv=0.4,h=3 ). Parameter ranges used are Xv∈{0,0.1,0.2,…,1} and h∈{0,0.5,1,…,5} . |