
Fig. 8 - Supplemental 1
- ID
- ZDB-FIG-250430-199
- Publication
- Hammond et al., 2025 - Modularity of the segmentation clock and morphogenesis
- Other Figures
-
- Fig. 1
- Fig. 2
- Fig. 2 - Supplemental 1
- Fig. 3
- Fig. 3 - Supplemental 1
- Fig. 4
- Fig. 4 - Supplemental 1
- Fig. 4 - Supplemental 2
- Fig. 4 - Supplemental 3
- Fig. 4 - Supplemental 4
- Fig. 4 - Supplemental 5
- Fig. 5
- Fig. 5 - Supplemental 1
- Fig. 5 - Supplemental 2
- Fig. 5 - Supplemental 3
- Fig. 6
- Fig. 6 - Supplemental 1
- Fig. 6 - Supplemental 2
- Fig. 6 - Supplemental 3
- Fig. 7
- Fig. 7 - Supplemental 1
- Fig. 8
- Fig. 8 - Supplemental 1
- Fig. 8 - Supplemental 2
- Fig. 8 - Supplemental 3
- Fig. 9
- Fig. 10
- All Figure Page
- Back to All Figure Page
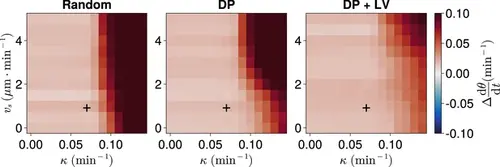
Frequency in the presence of coupling delay, for varying coupling strength κ and magnitude of intrinsic cell motion. vs . Difference from expected mean frequency (Δdθ/dt ) at the pre-somitic mesoderm (PSM) anterior after 1000 min, for varying maximum magnitude of intrinsic cell motion vs and clock phase coupling strength κ , for three different scenarios of cell ingression. Each pixel corresponds to the median value of anterior synchrony across N=100 simulations. A black + marks the experimental values for zebrafish, κ=0.07min−1 , vs=1µm⋅min−1 , derived in Riedel-Kruse et al., 2007, and Uriu et al., 2017, respectively, that are used elsewhere in this paper. All other parameters are held constant at their normal values (see Table 1). |