
FIGURE
Fig. 2 - Supplemental 1
- ID
- ZDB-FIG-250430-179
- Publication
- Hammond et al., 2025 - Modularity of the segmentation clock and morphogenesis
- Other Figures
-
- Fig. 1
- Fig. 2
- Fig. 2 - Supplemental 1
- Fig. 3
- Fig. 3 - Supplemental 1
- Fig. 4
- Fig. 4 - Supplemental 1
- Fig. 4 - Supplemental 2
- Fig. 4 - Supplemental 3
- Fig. 4 - Supplemental 4
- Fig. 4 - Supplemental 5
- Fig. 5
- Fig. 5 - Supplemental 1
- Fig. 5 - Supplemental 2
- Fig. 5 - Supplemental 3
- Fig. 6
- Fig. 6 - Supplemental 1
- Fig. 6 - Supplemental 2
- Fig. 6 - Supplemental 3
- Fig. 7
- Fig. 7 - Supplemental 1
- Fig. 8
- Fig. 8 - Supplemental 1
- Fig. 8 - Supplemental 2
- Fig. 8 - Supplemental 3
- Fig. 9
- Fig. 10
- All Figure Page
- Back to All Figure Page
Fig. 2 - Supplemental 1
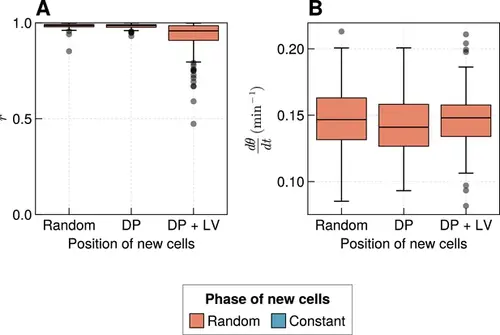
Effect of varying cell ingression position with random initial phases. (A) Oscillation synchrony (r ) at the pre-somitic mesoderm (PSM) anterior after 1000 min, for the three tested scenarios of cell ingression, with ingressing cells having random initial phase θi∈[0,2π). N=100 simulations. (B) Mean frequency of oscillations for cells at the PSM anterior after 1000 min of simulation, for the three tested scenarios of cell ingression, with ingressing cells having random initial phase θi∈[0,2π). N=100 simulations. |
Expression Data
Expression Detail
Antibody Labeling
Phenotype Data
Phenotype Detail
Acknowledgments
This image is the copyrighted work of the attributed author or publisher, and
ZFIN has permission only to display this image to its users.
Additional permissions should be obtained from the applicable author or publisher of the image.
Full text @ Elife