
Image
|
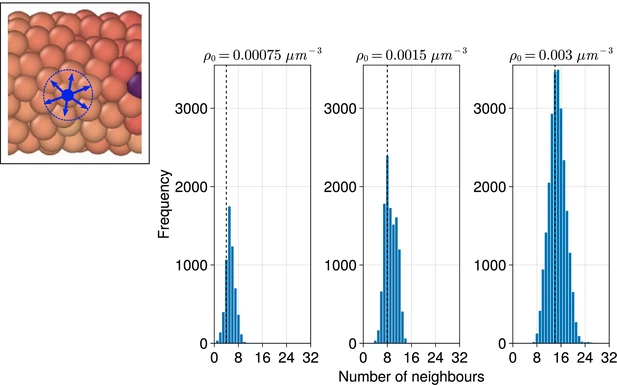
Figure Caption
Fig. 4 - Supplemental 1 Distribution of the number of neighbours for each cell when varying the density (ρ0 ) of the tissue. Distributions are calculated from final timepoints of individual simulations with random cell ingression with ρ0=0.00075,0.0015,0.003µm−3 by calculating the number of non-self cells within a cell’s radius (dc ) of each cell (see inset, left). The median of each distribution is shown with a black dashed line.
Acknowledgments
This image is the copyrighted work of the attributed author or publisher, and
ZFIN has permission only to display this image to its users.
Additional permissions should be obtained from the applicable author or publisher of the image.
Full text @ Elife